Fig. 7
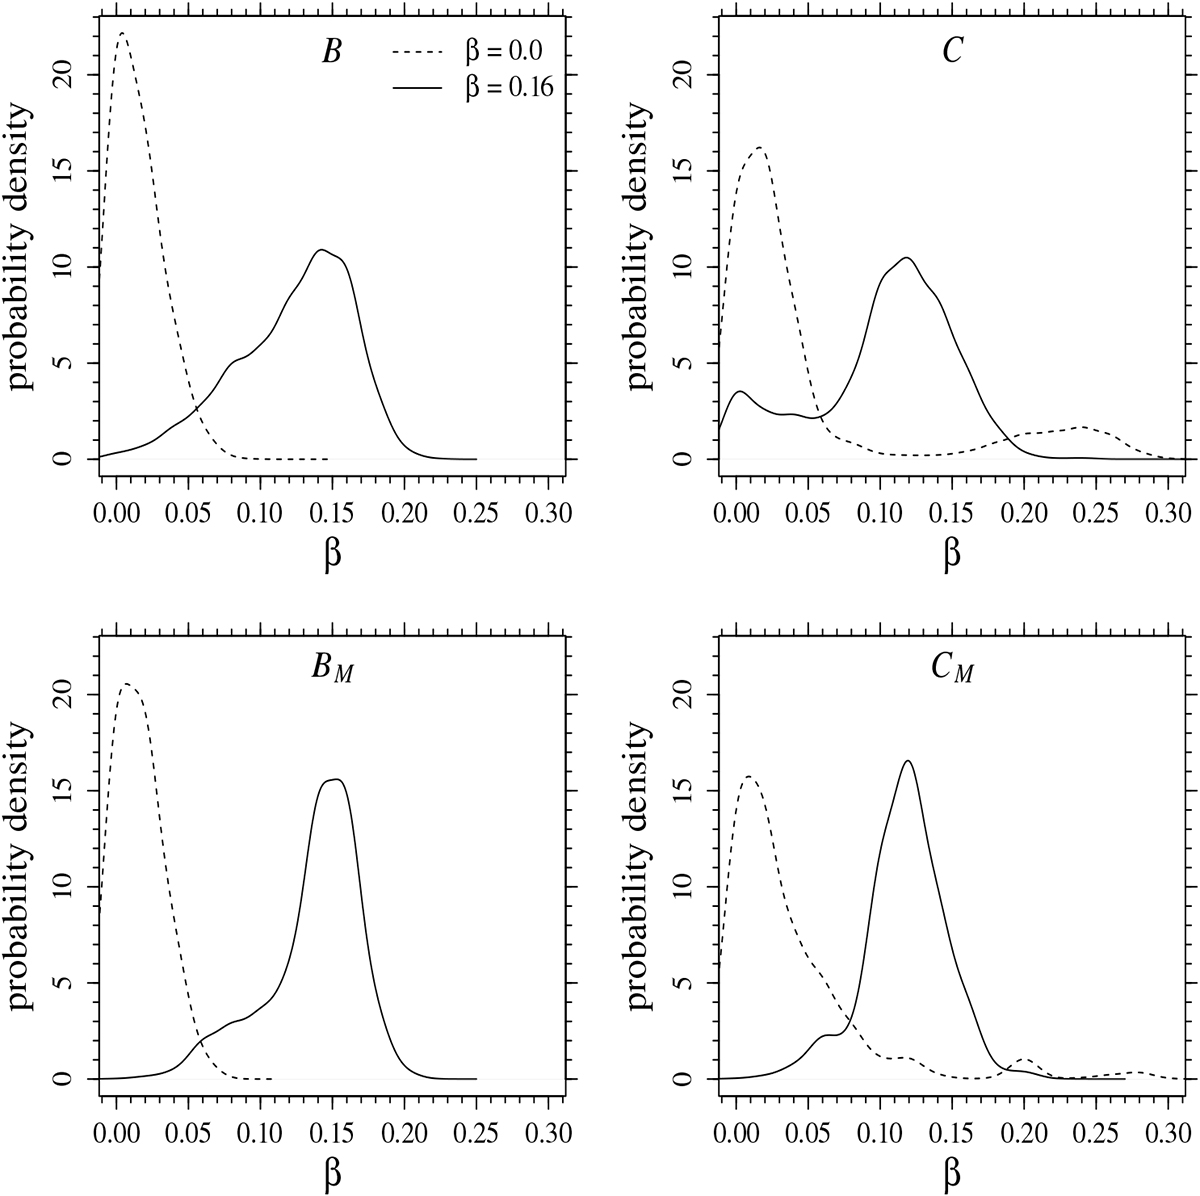
Top row, left panel: marginalized density of probability for the recovered β parameter under scenario B. The solid line corresponds to models sampled from the grid at β = 0.16, while the dashed one to models sampled at β = 0.0. Right panel: As in the left panel, but under scenario C. Bottom row:same as in the top row, but for precise mass scenarios BM and CM.
Current usage metrics show cumulative count of Article Views (full-text article views including HTML views, PDF and ePub downloads, according to the available data) and Abstracts Views on Vision4Press platform.
Data correspond to usage on the plateform after 2015. The current usage metrics is available 48-96 hours after online publication and is updated daily on week days.
Initial download of the metrics may take a while.