Fig. 5
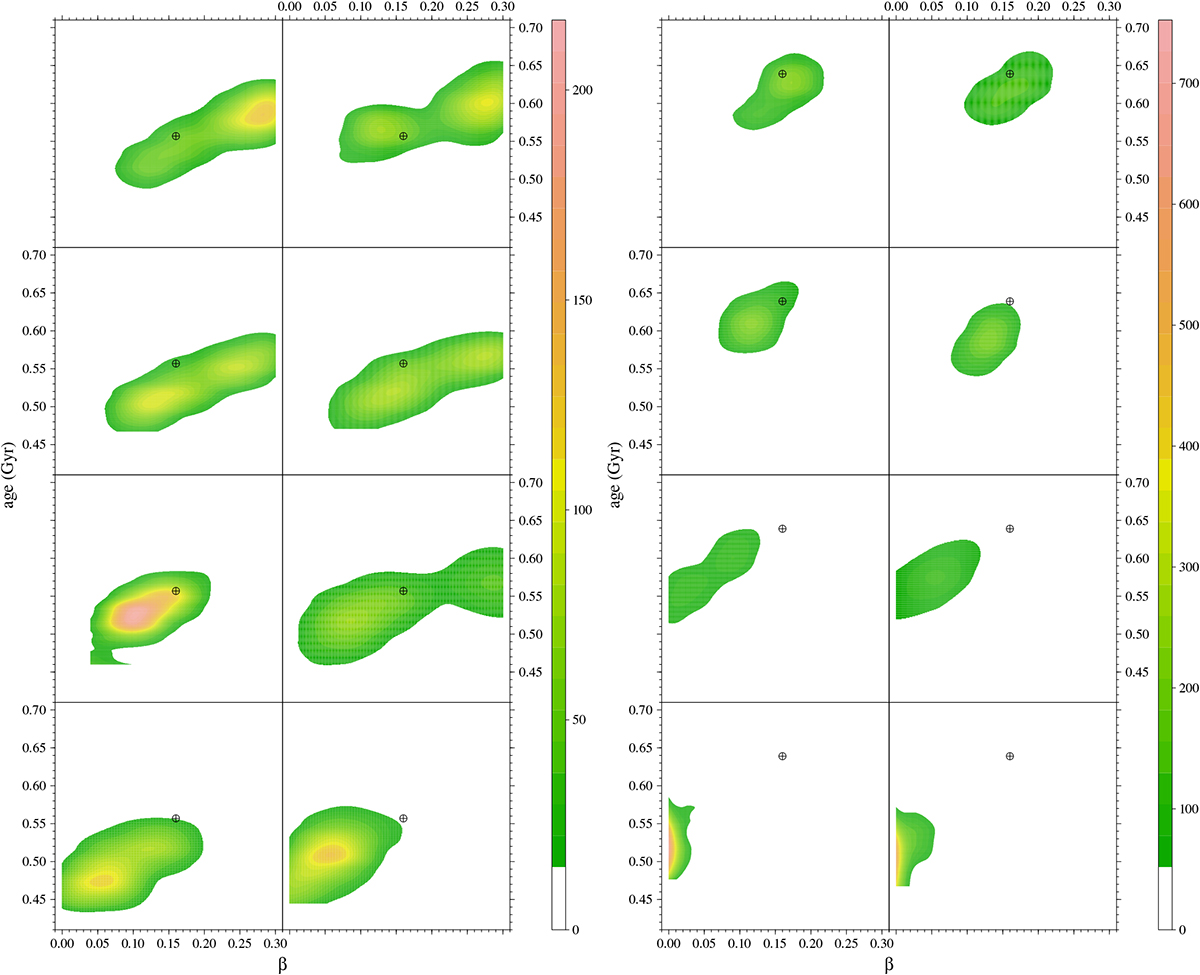
Left panel, top row: two realisations of the bi-dimensional density of probability in the age vs. β plane for twoartificial systems under scenario A, with median estimated β = 0.26. Second row: as in the top row but for median estimated β = 0.18. Third row: as in the top row but for median estimated β = 0.12. Bottom row:as in the top row but for median estimated β = 0.06. The shown probability densities correspond to eight artificially perturbed systems. Right panel: as in the left panel for scenario C; from top to bottom the estimated β are 0.16, 0.12, 0.06, 0.0. The crosses indicate the position of the reference β and age values.
Current usage metrics show cumulative count of Article Views (full-text article views including HTML views, PDF and ePub downloads, according to the available data) and Abstracts Views on Vision4Press platform.
Data correspond to usage on the plateform after 2015. The current usage metrics is available 48-96 hours after online publication and is updated daily on week days.
Initial download of the metrics may take a while.