Fig. 3
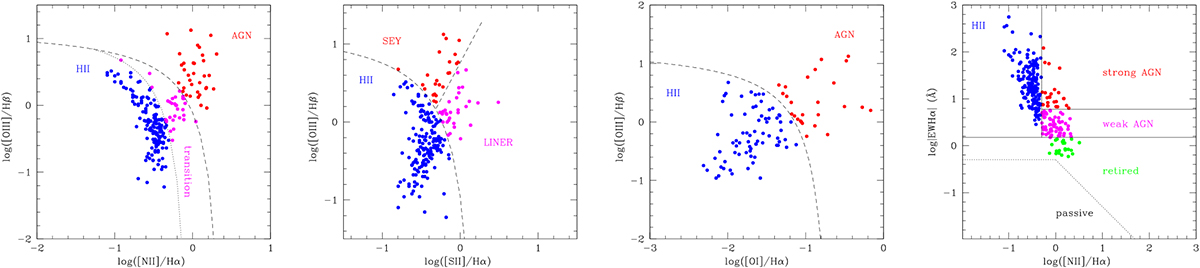
Nuclear diagnostic diagrams for the whole HRS sample limited to emission-line objects with S∕N > 3. In the left BPT diagram panel, the broken separation line between AGNs (red) and TRAN (pink) galaxies is from Kewley et al. (2001), while the dotted separation line between TRAN (pink) and HII region-like nuclei (blue) is from K03. In the second BPT diagram panel, the extreme starburst classification line is from Kewley et al. (2001), while the separation between LINER (pink) and SEY (red) is from Kewley et al. (2006). We note that the pink filled symbols refer to different types of objects in the three diagrams. The third panel reports the BPT diagram for the minority of galaxies (101) with [OI] in emission. In the WHAN diagram the separations between the different classes are from Gavazzi et al. (2011).
Current usage metrics show cumulative count of Article Views (full-text article views including HTML views, PDF and ePub downloads, according to the available data) and Abstracts Views on Vision4Press platform.
Data correspond to usage on the plateform after 2015. The current usage metrics is available 48-96 hours after online publication and is updated daily on week days.
Initial download of the metrics may take a while.