Free Access
Fig. 2
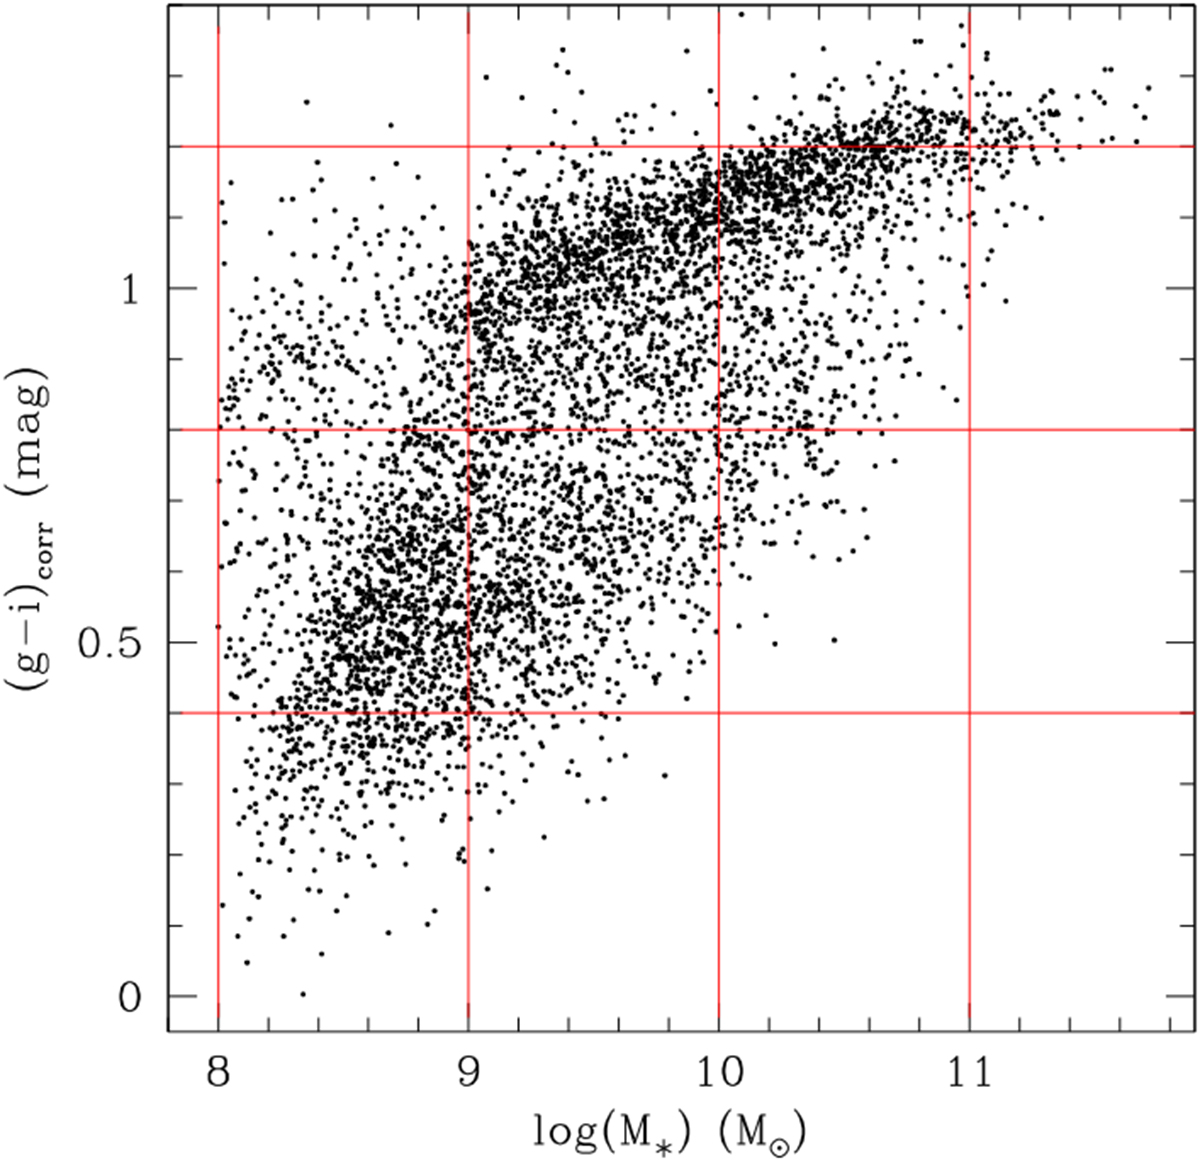
Color-stellar mass relation for a complete sample of galaxies in the Coma and Local supercluster from Consolandi et al. (2016), subdivided into nine bins of stellar mass and color. In these bins we compute the average SDSS continuum correction to Hα (see Table 1).
Current usage metrics show cumulative count of Article Views (full-text article views including HTML views, PDF and ePub downloads, according to the available data) and Abstracts Views on Vision4Press platform.
Data correspond to usage on the plateform after 2015. The current usage metrics is available 48-96 hours after online publication and is updated daily on week days.
Initial download of the metrics may take a while.