Fig. 2
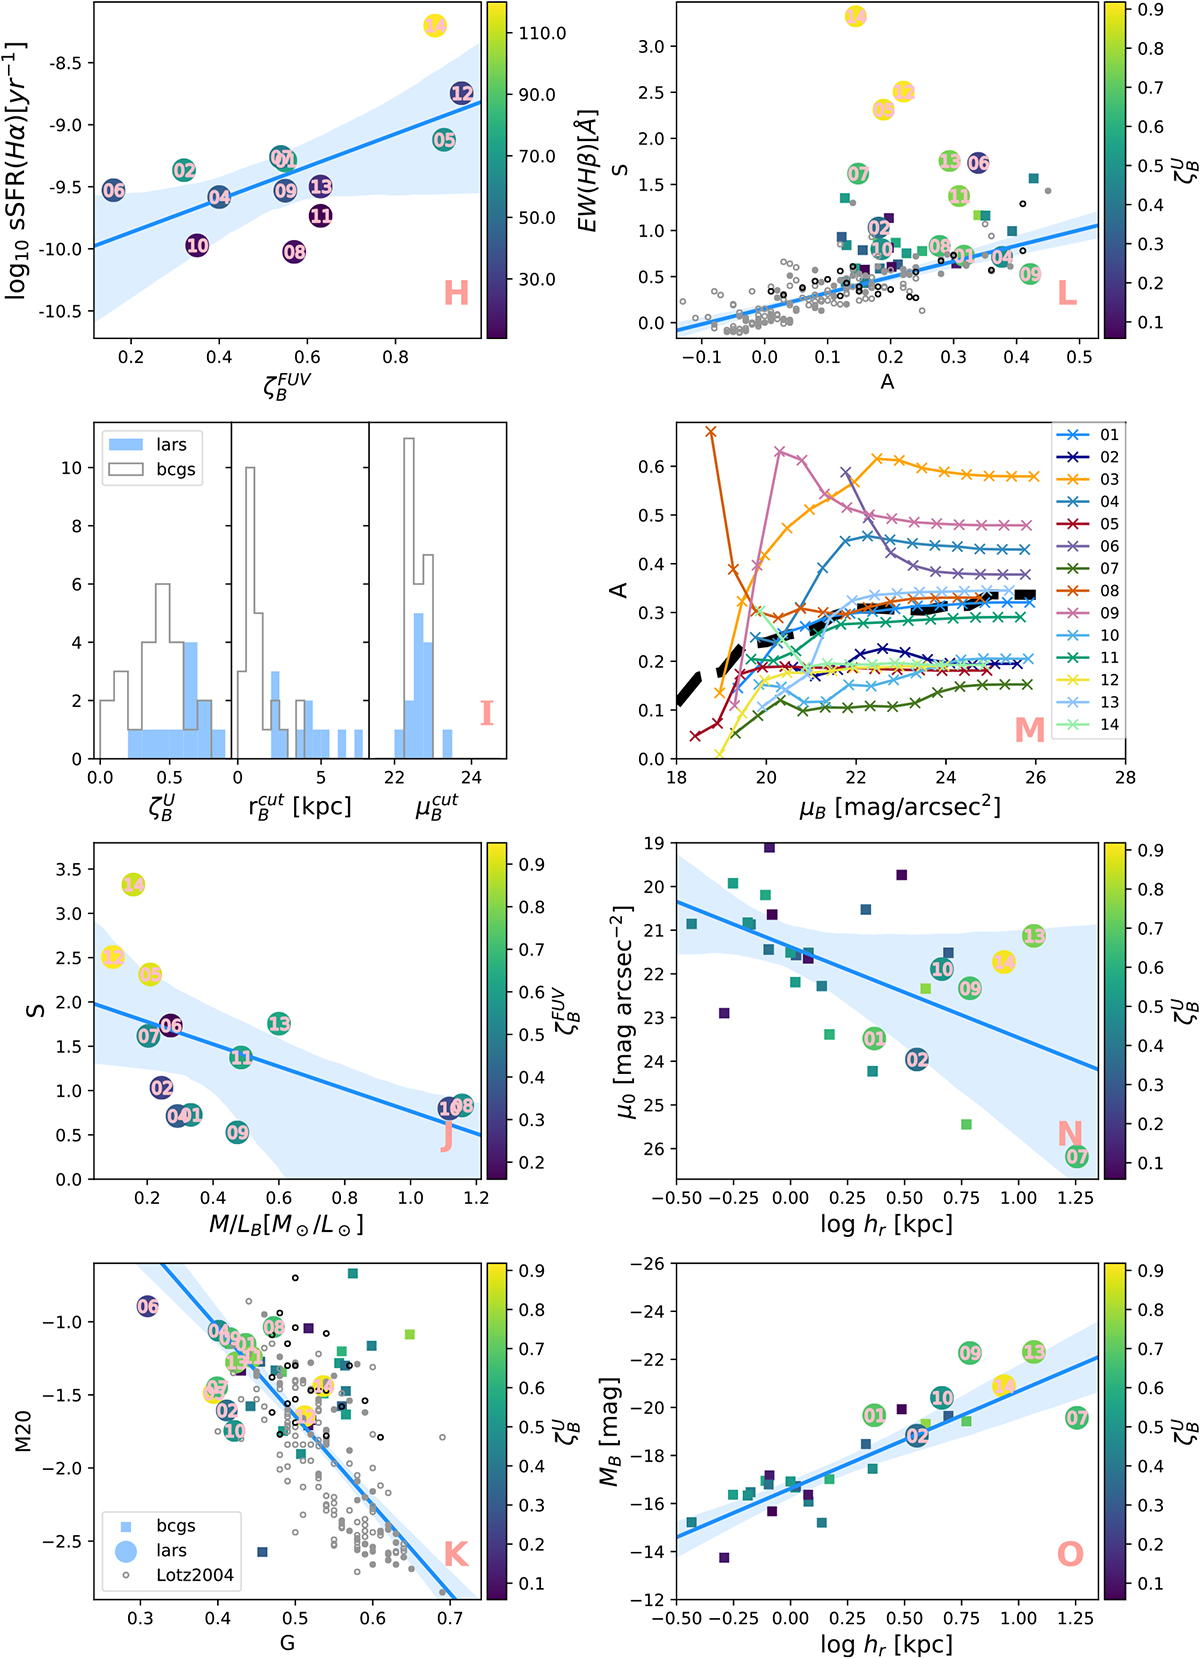
Panel H: LARS sSFR(Hα) and burst fraction ![]() , color-coded by EW(Hβ). Panel I: comparison between LARS and BCG burst fractions, cutoff radii [kpc] and B-band cutoff surface brightness. Panel J: LARS clumpiness S vs. median M/LB ratio, color-coded by
, color-coded by EW(Hβ). Panel I: comparison between LARS and BCG burst fractions, cutoff radii [kpc] and B-band cutoff surface brightness. Panel J: LARS clumpiness S vs. median M/LB ratio, color-coded by ![]() . Panel K: M20 vs. Gini coefficients, color-coded by
. Panel K: M20 vs. Gini coefficients, color-coded by ![]() . The Lotz et al. (2004) sample contains E/S0-Sd (gray open circles) from Frei et al. (1996), SDSS u-band selected galaxies (gray filled circles) and dIrr (open black circles) from van Zee (2001). Panel L: as in panel K but for clumpiness S vs. asymmetry A. Panel M: asymmetry A as a function of B-band isophotal surface brightness μB. The average from all galaxies is indicated with a dashed black line. Panel N: central surface brightness μ0 and scale length [kpc] from the 1D fit (Sect. 3.6). Panel O: absolute B-band magnitude and 1D fit scale length. All panels: shaded area is the confidence interval of the linear regression (blue solid line). BCG photometry has been converted from Vega mag to AB mag. Galactic extinction and surface brightness dimming has been applied. Numbers inside markers indicate the LARS number.
. The Lotz et al. (2004) sample contains E/S0-Sd (gray open circles) from Frei et al. (1996), SDSS u-band selected galaxies (gray filled circles) and dIrr (open black circles) from van Zee (2001). Panel L: as in panel K but for clumpiness S vs. asymmetry A. Panel M: asymmetry A as a function of B-band isophotal surface brightness μB. The average from all galaxies is indicated with a dashed black line. Panel N: central surface brightness μ0 and scale length [kpc] from the 1D fit (Sect. 3.6). Panel O: absolute B-band magnitude and 1D fit scale length. All panels: shaded area is the confidence interval of the linear regression (blue solid line). BCG photometry has been converted from Vega mag to AB mag. Galactic extinction and surface brightness dimming has been applied. Numbers inside markers indicate the LARS number.
Current usage metrics show cumulative count of Article Views (full-text article views including HTML views, PDF and ePub downloads, according to the available data) and Abstracts Views on Vision4Press platform.
Data correspond to usage on the plateform after 2015. The current usage metrics is available 48-96 hours after online publication and is updated daily on week days.
Initial download of the metrics may take a while.