Fig. 1
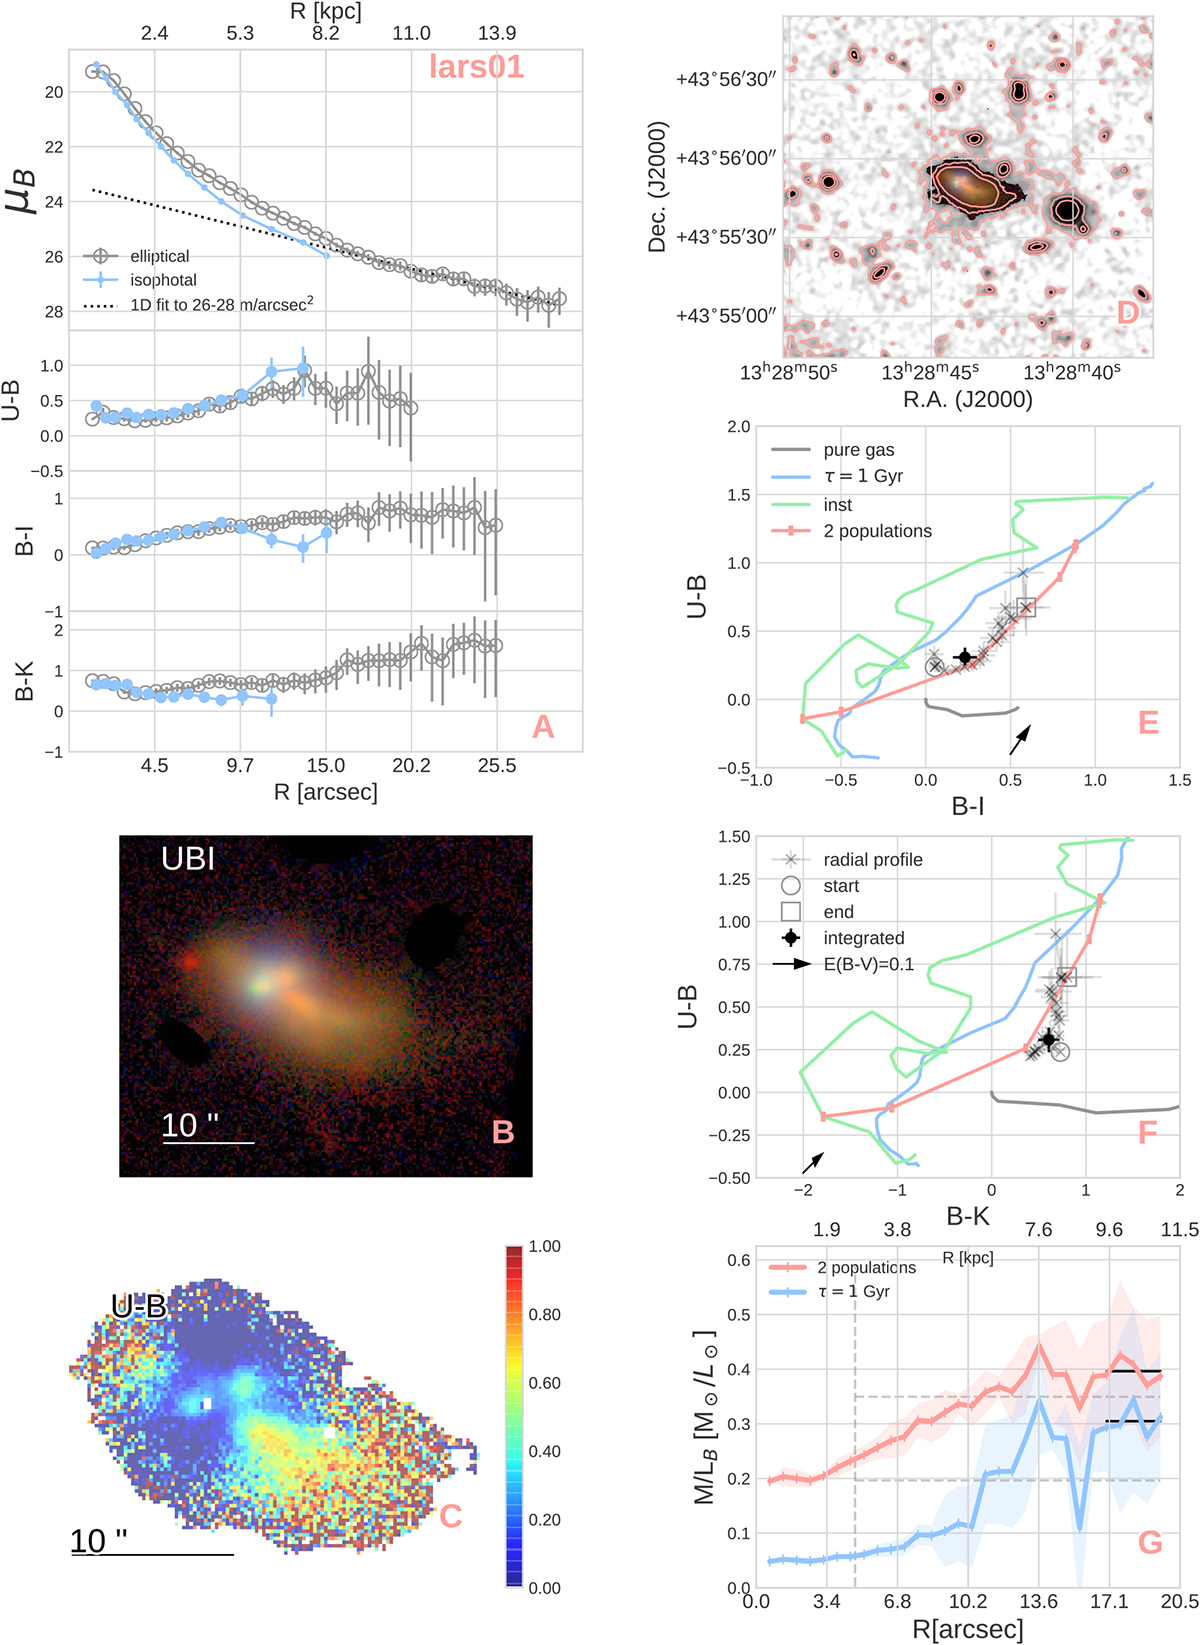
LARS01: panel A: Surface brightness and color profiles with elliptical and isophotal integration. Where possible, a one-dimensional (1D) fit to the region μB = 26–28 mag arcsec−2 is shown (dotted line). Panel B: RGB image with (red, green, blue) = (I, B, U) bands. Panel C: U−B color map. Panel D: deep contours with varying isophotal levels and showing the center of integration (cross). Panels E, F: Color–color diagrams showing the radial color profiles (gray crosses), the total integrated color (filled black circle), instantaneous burst model (green solid line), a model with decaying SFR of e-folding time 1 Gyr (blue solid line), a mixture of two stellar populations (red solid line), pure gas emission from an instantaneous burst (gray solid line) and a dust attenuation arrow for E(B − V ) = 0.1. Panel G: Yggdrasil model mass-to-light radial profiles from Sect. 3.7. Also indicated are the FUV rcut radius (vertical dashed line) and the M/L used to estimate the stellar mass of the outskirts (circle if no radial overlap, solid black line if radial overlap, gray dashed line for average).
Current usage metrics show cumulative count of Article Views (full-text article views including HTML views, PDF and ePub downloads, according to the available data) and Abstracts Views on Vision4Press platform.
Data correspond to usage on the plateform after 2015. The current usage metrics is available 48-96 hours after online publication and is updated daily on week days.
Initial download of the metrics may take a while.