Fig. 3
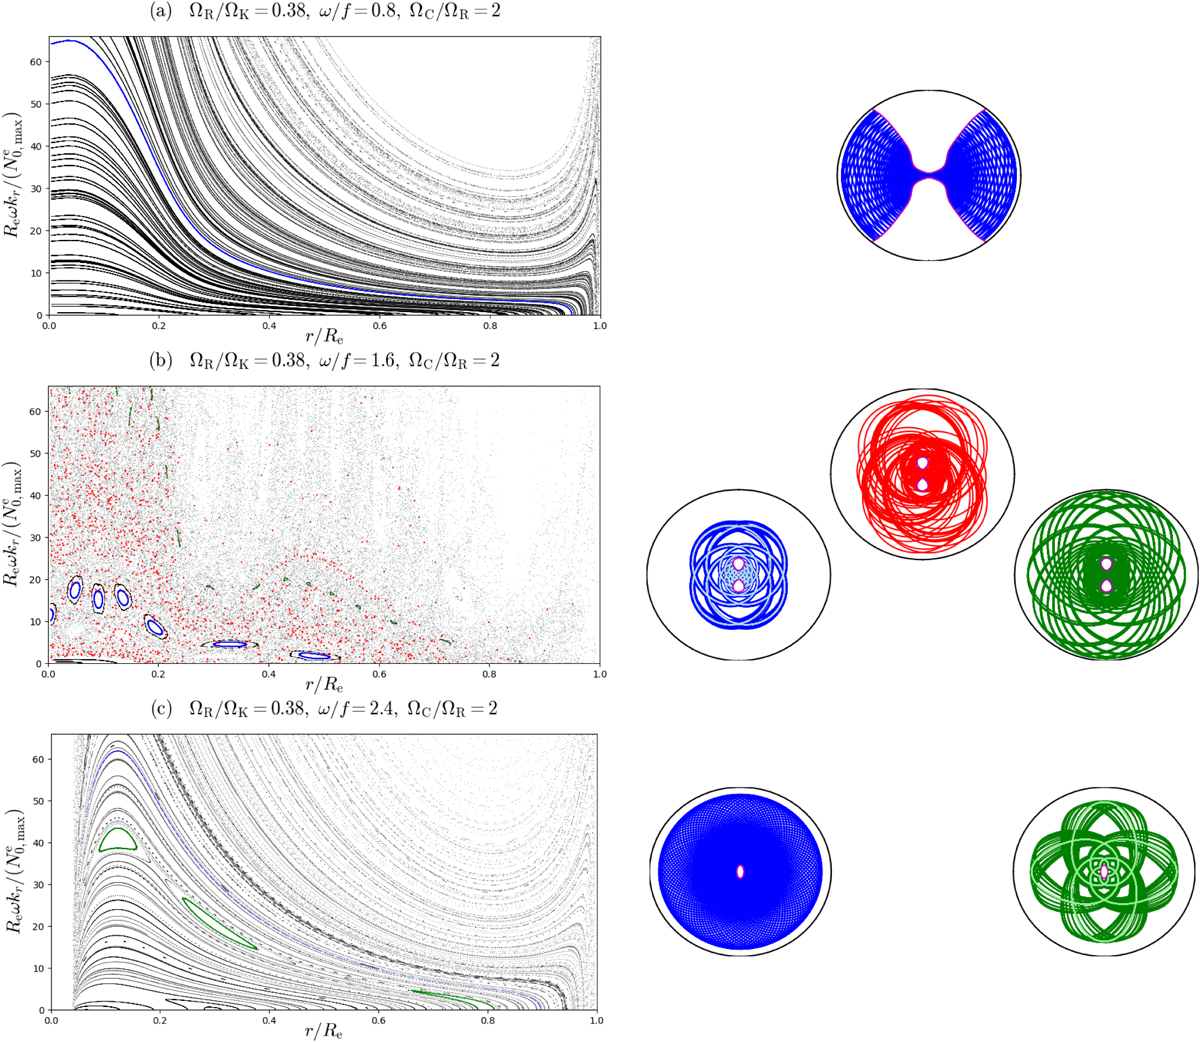
PSS (left) and examples of ray trajectories (right) for the three regimes identified in Fig. 2: sub-, trans-, and super-inertial, respectively. Blue trajectories correspond to invariant tori (except for the second case, which corresponds to an island chain), green ones to island chains, and the red one to a chaotic zone. Lighter blue and green trajectories correspond to periodic orbits at the centre of the islands. Magenta lines are the limits of the domain of propagation. The imprints of the rays are shown on the PSS with colours corresponding to the rays.
Current usage metrics show cumulative count of Article Views (full-text article views including HTML views, PDF and ePub downloads, according to the available data) and Abstracts Views on Vision4Press platform.
Data correspond to usage on the plateform after 2015. The current usage metrics is available 48-96 hours after online publication and is updated daily on week days.
Initial download of the metrics may take a while.