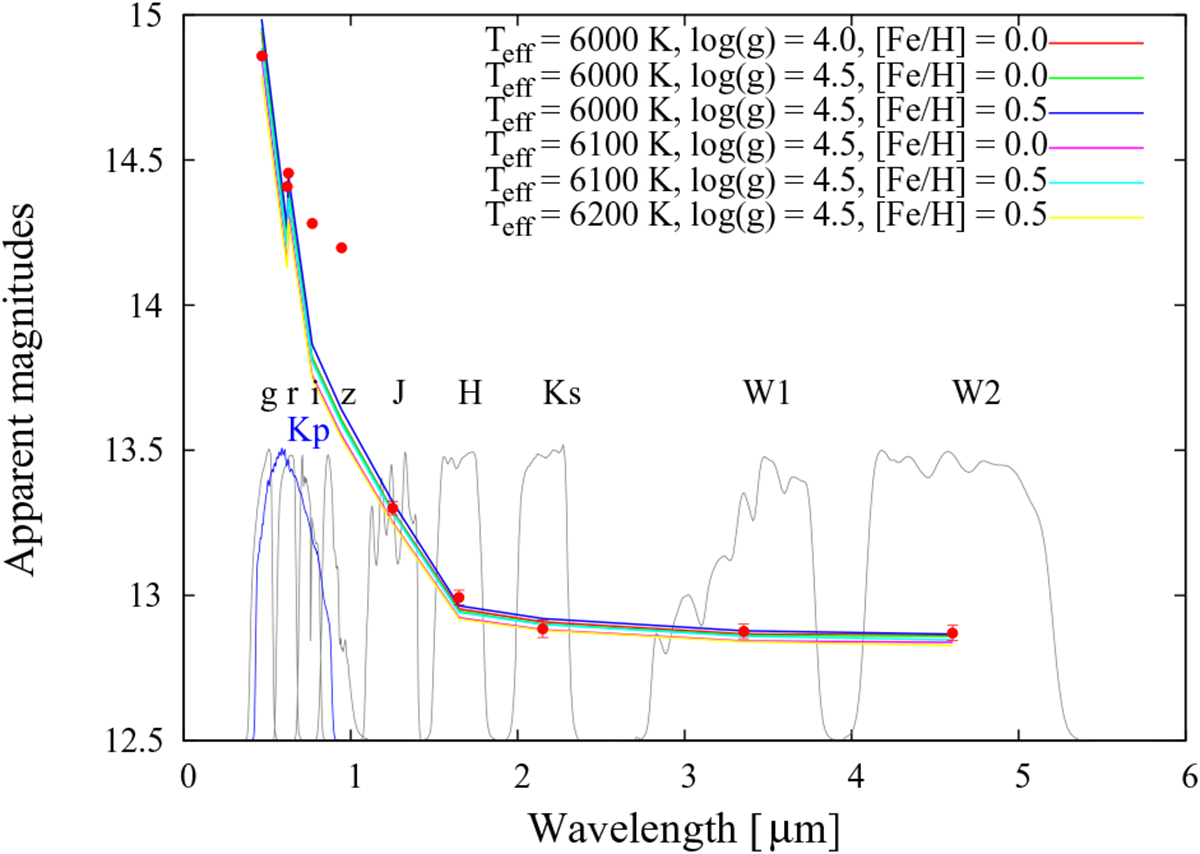
Fig. 9

Spectral energy distribution for KOI-0410. The figure shows apparent magnitudes as a function of wavelength, in μm. Shifted and scaled to match the figure, the filter transmission functions are shown with gray and blue continuous lines. At the top, their respective names: Sloan g, r, i and z, Kepler band (Kp), 2MASS J, H and Ks, and WISE W1, W2. The first five quantities do not have uncertainties.
Current usage metrics show cumulative count of Article Views (full-text article views including HTML views, PDF and ePub downloads, according to the available data) and Abstracts Views on Vision4Press platform.
Data correspond to usage on the plateform after 2015. The current usage metrics is available 48-96 hours after online publication and is updated daily on week days.
Initial download of the metrics may take a while.


