Fig. 7
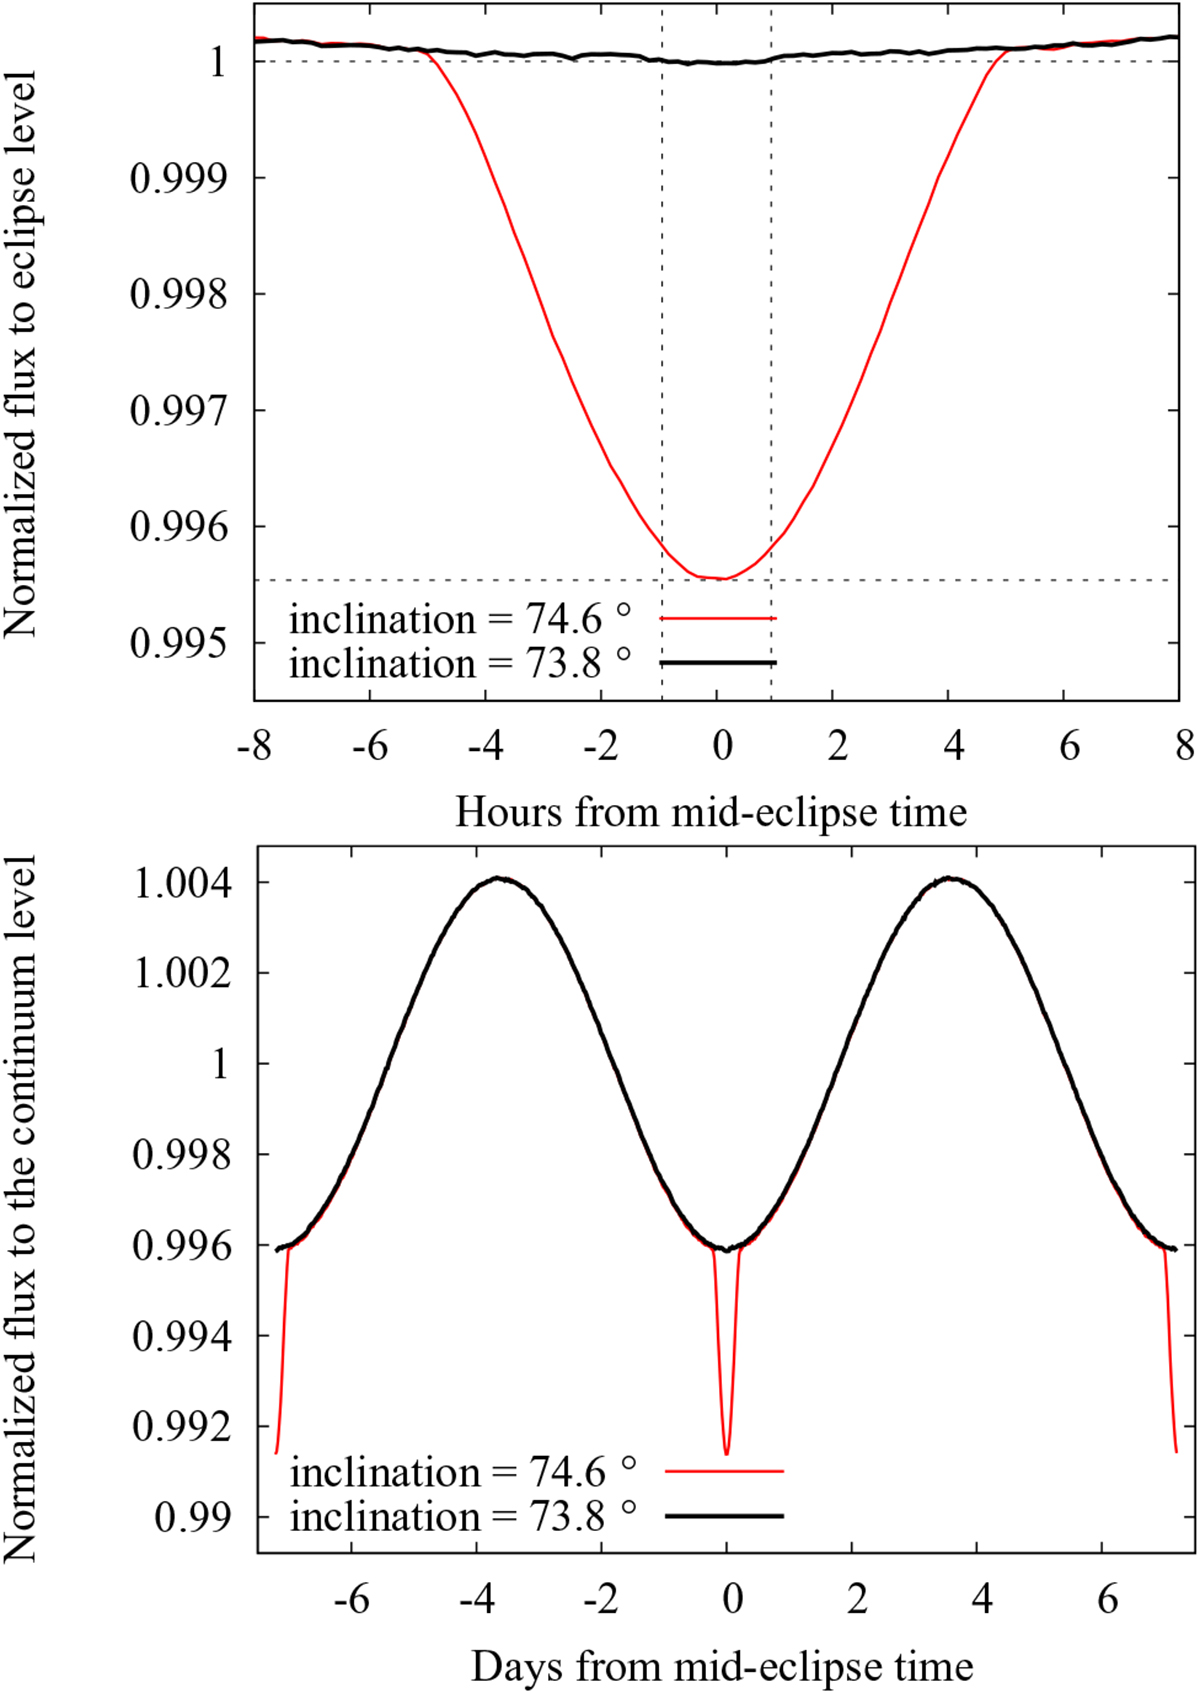
PHOEBE models for two identical G-type stars in a ~14.4-day orbit, for an inclination of 74.6° and 73.8° (red and black continuous lines, respectively). Top: zoom-in around the eclipses. Time is given in hours. Horizontal and vertical dashed lines indicate the transit duration and depth, respectively, for visual inspection. Bottom: complete orbits, highlighting the continuum flux variability.
Current usage metrics show cumulative count of Article Views (full-text article views including HTML views, PDF and ePub downloads, according to the available data) and Abstracts Views on Vision4Press platform.
Data correspond to usage on the plateform after 2015. The current usage metrics is available 48-96 hours after online publication and is updated daily on week days.
Initial download of the metrics may take a while.