Fig. 6
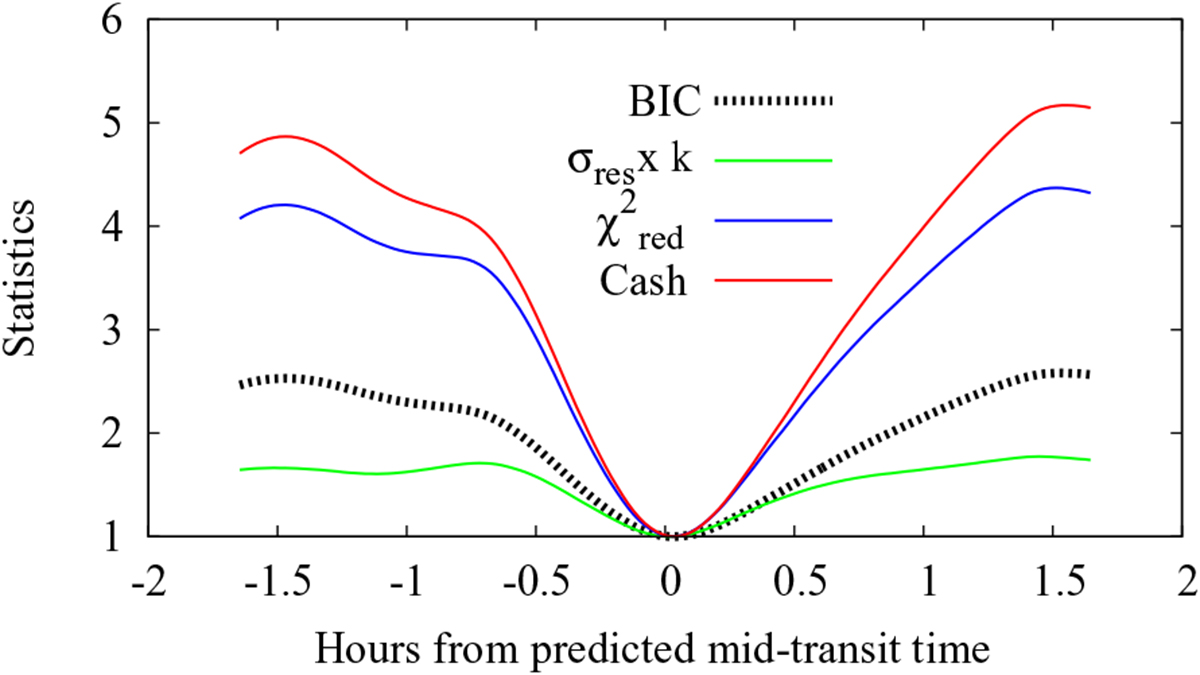
Four statistics used to assess the number of detrending components and the starting mid-transit time, obtained by analyzing the KOI-0760 data. Their values have been normalized and scaled to allow for visual comparison. The thick dashed black line corresponds to the time-averaged BIC statistics, as shown in the top panel of Fig. 5.
Current usage metrics show cumulative count of Article Views (full-text article views including HTML views, PDF and ePub downloads, according to the available data) and Abstracts Views on Vision4Press platform.
Data correspond to usage on the plateform after 2015. The current usage metrics is available 48-96 hours after online publication and is updated daily on week days.
Initial download of the metrics may take a while.