Fig. 5
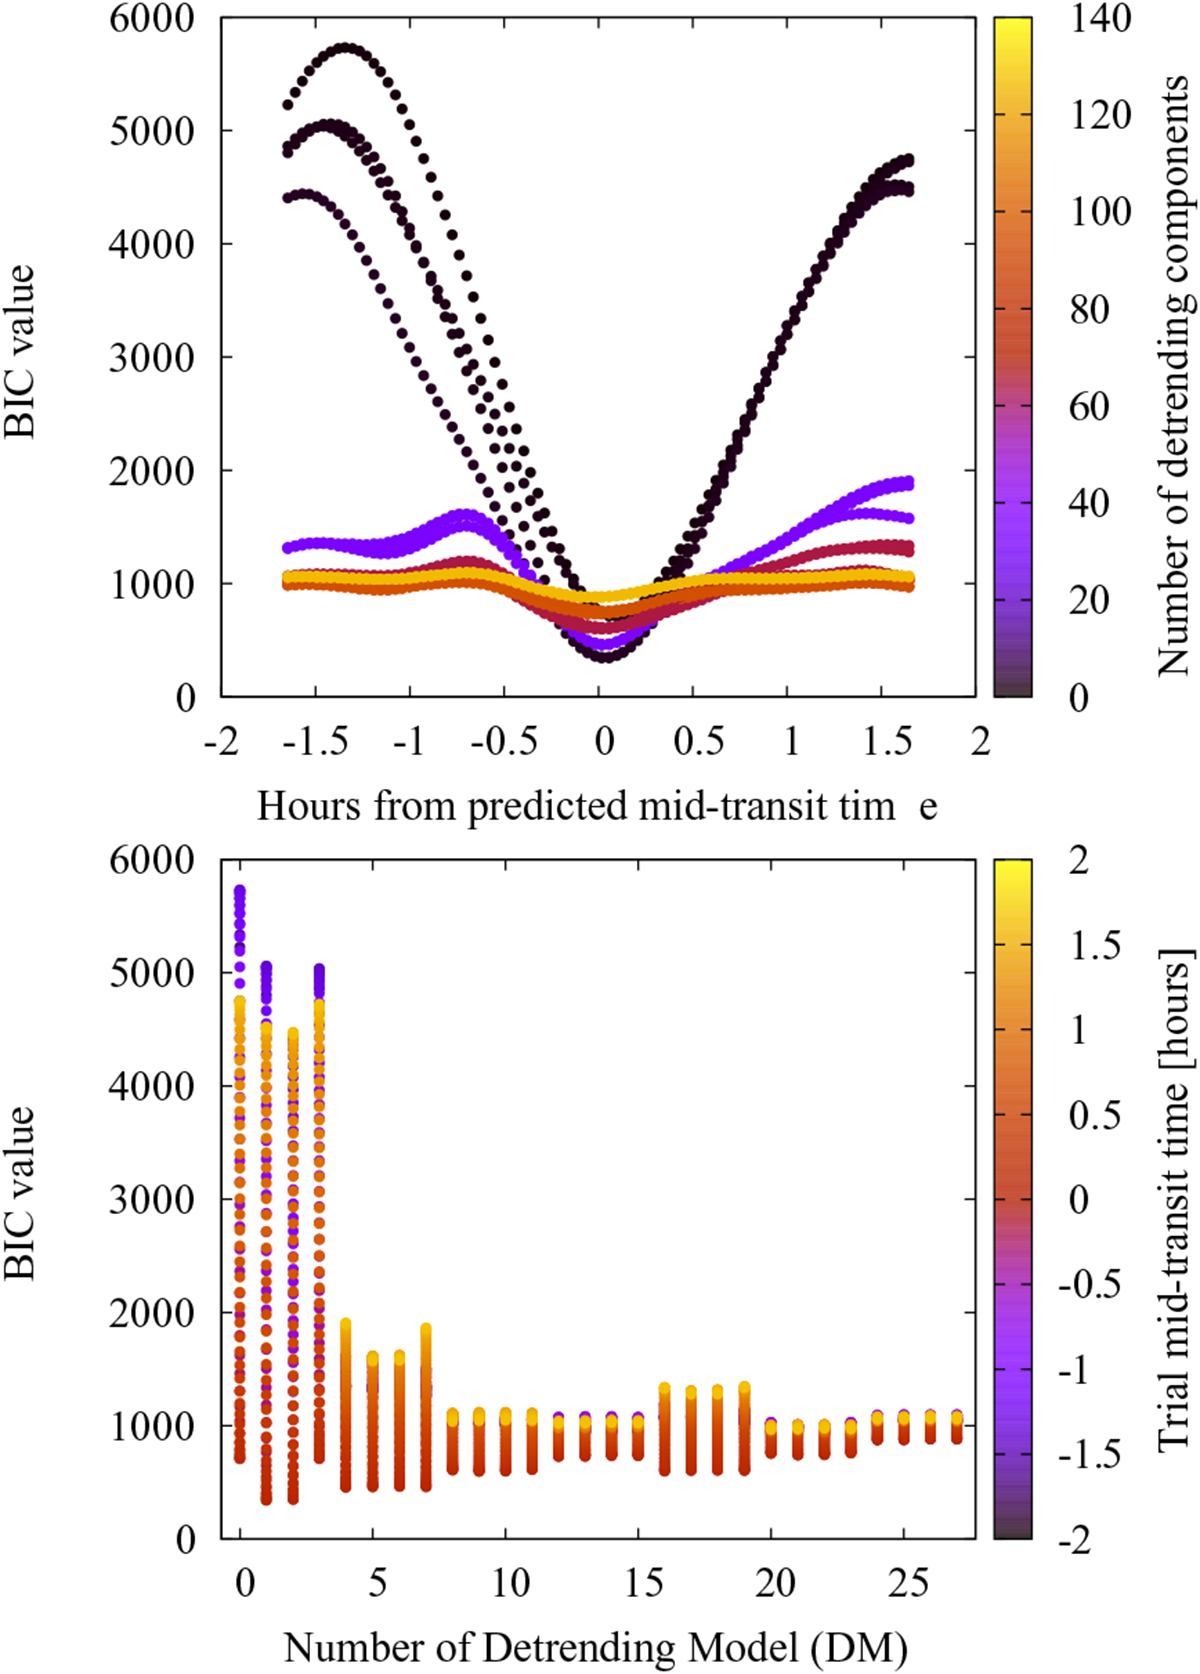
Top: BIC values as a function of trial mid-transit times. Color-coded are the number of detrending components for each of the detrending models (submodels). Darker colors correspond to a smaller number of detrending components. Bottom: same BIC values, but now as a function of the detrending model, DM. Numbers on the abscissa are in agreement with the labels on Eq. (5). Color-coded are the trial T0 ’s. According tothe color scale, red points correspond to T0 = 0.
Current usage metrics show cumulative count of Article Views (full-text article views including HTML views, PDF and ePub downloads, according to the available data) and Abstracts Views on Vision4Press platform.
Data correspond to usage on the plateform after 2015. The current usage metrics is available 48-96 hours after online publication and is updated daily on week days.
Initial download of the metrics may take a while.