Fig. 2
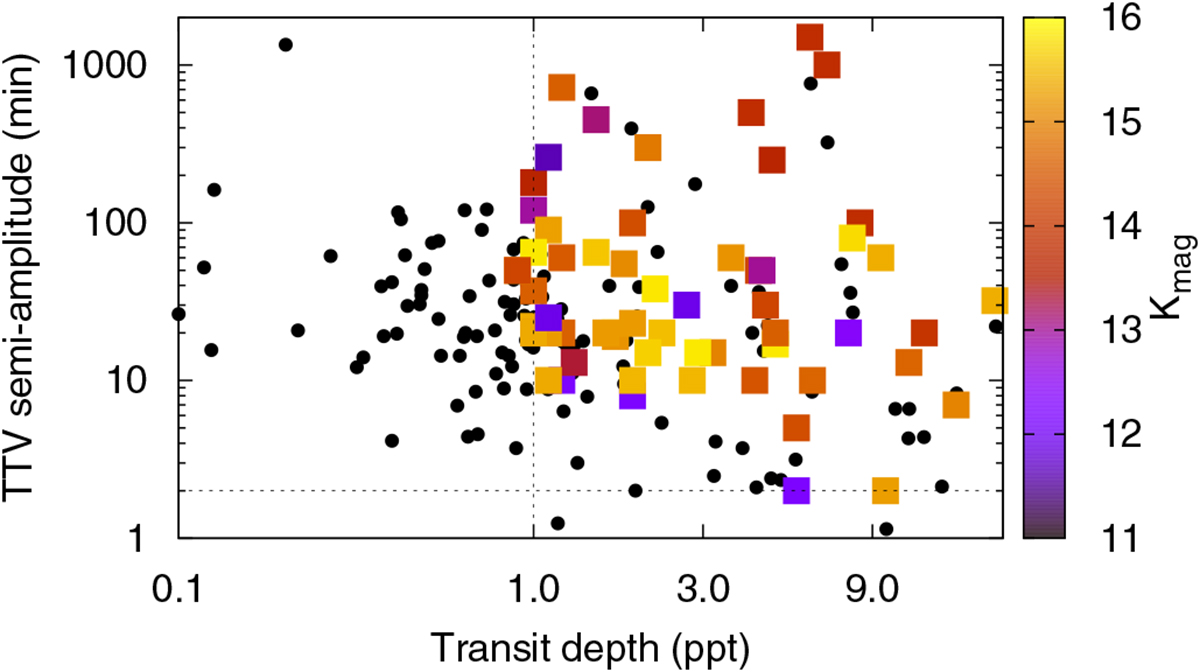
Kepler TTV variability in minutes versus transit depth in ppt for the 60 KOIs that are included in KOINet (colored rectangles). The squares are color-coded depending on the Kepler magnitude of the host star. Black circles show all the KOIs presenting TTVs with a Kepler variability larger than 1 minute. Vertical and horizontal dashed lines indicate the ~1 ppt and 2-min limits for KOINet.
Current usage metrics show cumulative count of Article Views (full-text article views including HTML views, PDF and ePub downloads, according to the available data) and Abstracts Views on Vision4Press platform.
Data correspond to usage on the plateform after 2015. The current usage metrics is available 48-96 hours after online publication and is updated daily on week days.
Initial download of the metrics may take a while.