Free Access
Fig. A.1
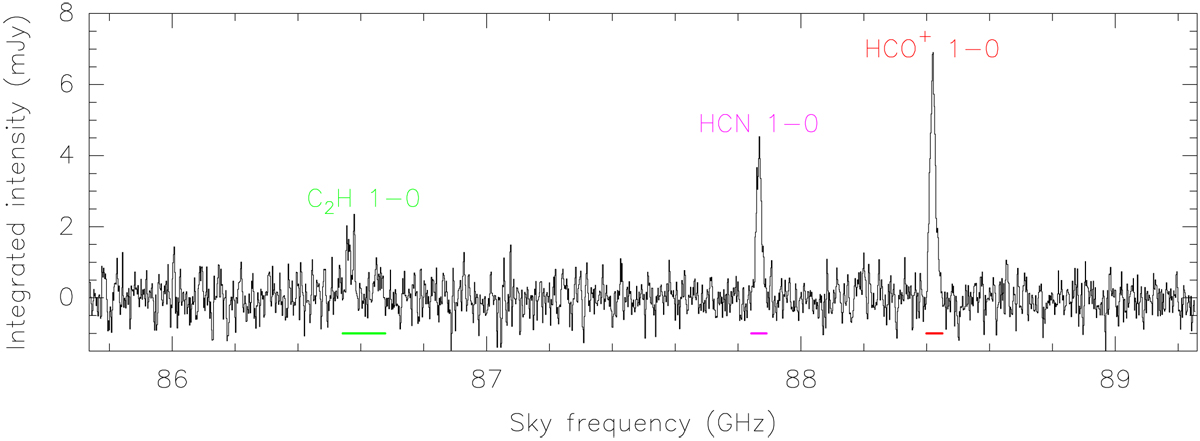
NOEMA spectrum of the WideX 3.6 GHz bandwidth (at ~1.95 MHz (~ 6.6km s-1) channel spacing) extracted from the naturally weighted data cube. The position of the HCO+, HCN and C2H 1−0 lines are indicated in color. We note that due to hyperfine splitting, C2H 1−0 shows two emission line components.
Current usage metrics show cumulative count of Article Views (full-text article views including HTML views, PDF and ePub downloads, according to the available data) and Abstracts Views on Vision4Press platform.
Data correspond to usage on the plateform after 2015. The current usage metrics is available 48-96 hours after online publication and is updated daily on week days.
Initial download of the metrics may take a while.