Fig. 4
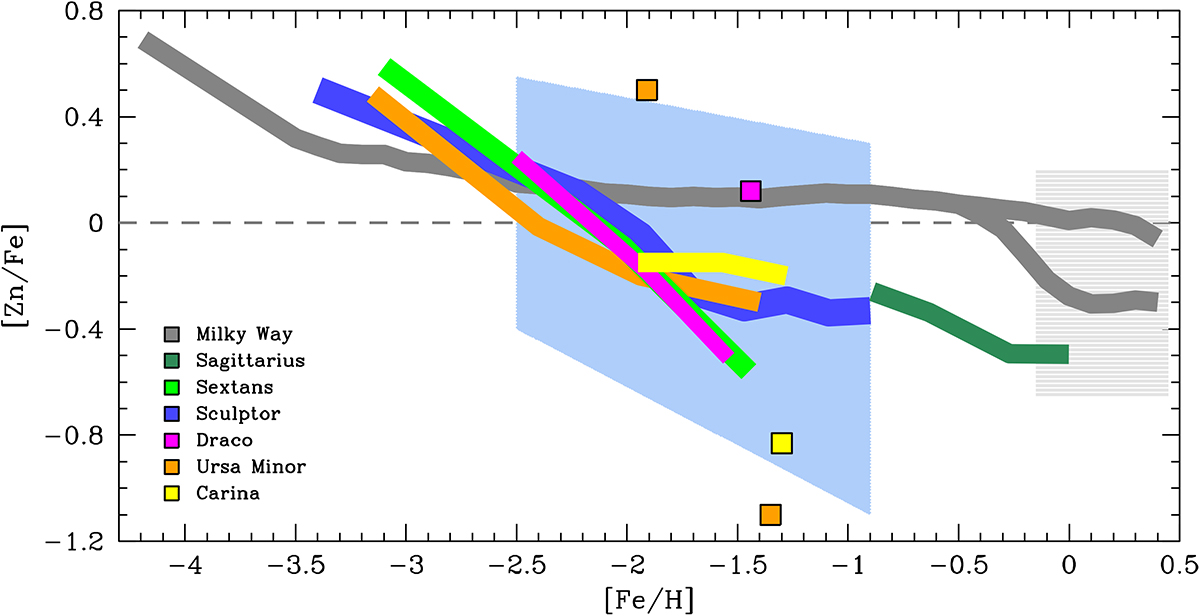
Schematic figure of [Zn/Fe] as a function of [Fe/H] in the Milky Way (gray) and its dwarf galaxy satellites: Sagittarius (dark green), Sextans (green), Sculptor (blue), Draco (pink), Ursa Minor (orange) and Carina (yellow). Lines show mean trends, while scatter is indicated by shaded areas, and notable outliers are identified by individual squares. The two branches at [Fe/H] ≳−0.5 in the Milky Way represent the mean trends as measured by dwarf stars (higher values) and giant stars (lower values). References: Dwarf galaxies: see Table 1. Milky Way: Reddy et al. (2003, 2006), Cayrel et al. (2004), Nissen & Schuster (2011), Ishigaki et al. (2013), Bensby et al. (2014), Barbuy et al. (2015), and Duffau et al. (2017).
Current usage metrics show cumulative count of Article Views (full-text article views including HTML views, PDF and ePub downloads, according to the available data) and Abstracts Views on Vision4Press platform.
Data correspond to usage on the plateform after 2015. The current usage metrics is available 48-96 hours after online publication and is updated daily on week days.
Initial download of the metrics may take a while.