Fig. 2
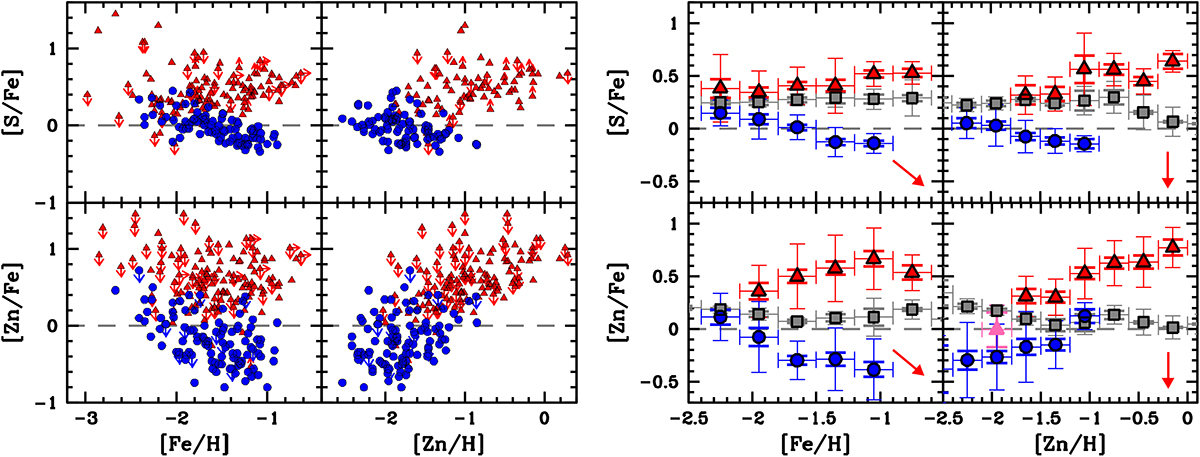
Left panel: abundance ratios of [S/Fe] and [Zn/Fe] in DLAs with z < 1.5 (red triangles) and Sculptor stars (blue circles) as a function of [Fe/H] and [Zn/H]. Right panel: same with binned data, excluding upper/lower limits. Also included are Milky Way dwarf stars as gray squares. The size of each bin is shown with x-axis error bars. The thick y-axis error bars show the error of the mean in each bin, while thin show 1σ of the scatter. The pink triangle only includes three DLAs. Red arrows show the direction (but not necessarily the size) of dust depletion corrections that should be applied to DLA abundances. We note that the range of both the x- and y-axis is not the same on the left and right panels. References: DLAs: Compilation by Quiret et al. (2016); Sculptor: Skúladóttir et al. (2017) (Zn), Skúladóttir et al. (2015a) (S), Skúladóttir et al. (2015b) (1 star); Milky Way: Reddy et al. (2003, 2006), Nissen et al. (2007).
Current usage metrics show cumulative count of Article Views (full-text article views including HTML views, PDF and ePub downloads, according to the available data) and Abstracts Views on Vision4Press platform.
Data correspond to usage on the plateform after 2015. The current usage metrics is available 48-96 hours after online publication and is updated daily on week days.
Initial download of the metrics may take a while.