Fig. 7
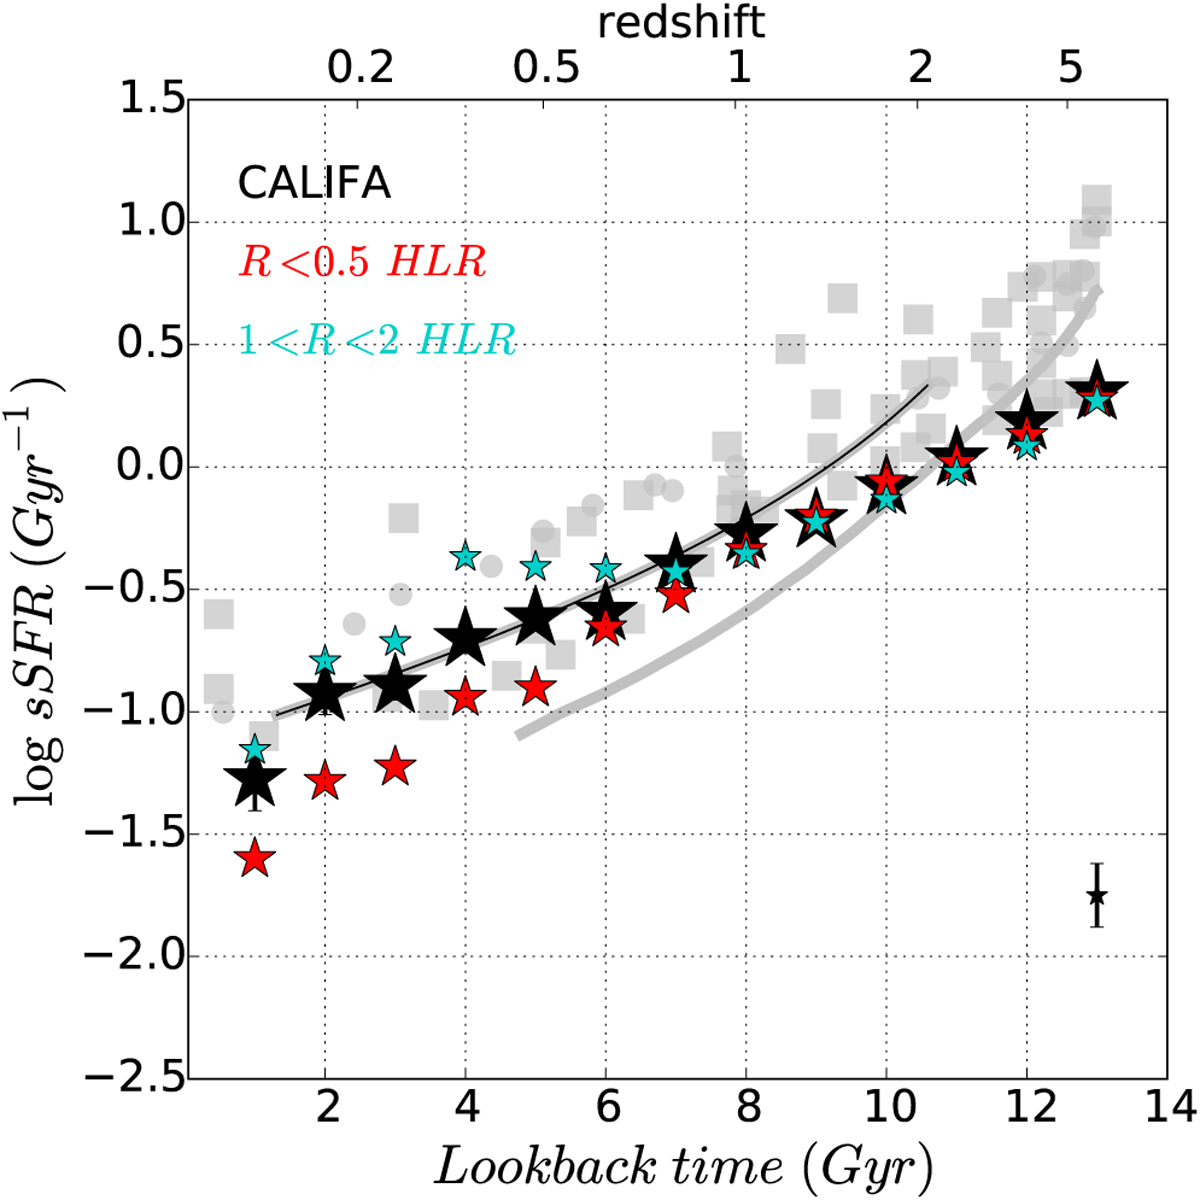
Cosmic evolution of the sSFR(t) in the present study (black stars). The gray line is from Madau & Dickinson (2014), the dark gray line is the
![]() relation for z < 2 from Elbaz et al. (2007), and gray symbols are from a compilation by Lehnert et al. (2015). Red and blue stars show the sSFR(t) corresponding to regions at the current epoch located at R < 0.5 HLR and1 < R < 2 HLR. The bars are the error in the mean, computed as the r.m.s. of the sSFR(t) values at each epoch divided by the square root of the number of galaxies in each bin.
relation for z < 2 from Elbaz et al. (2007), and gray symbols are from a compilation by Lehnert et al. (2015). Red and blue stars show the sSFR(t) corresponding to regions at the current epoch located at R < 0.5 HLR and1 < R < 2 HLR. The bars are the error in the mean, computed as the r.m.s. of the sSFR(t) values at each epoch divided by the square root of the number of galaxies in each bin.
Current usage metrics show cumulative count of Article Views (full-text article views including HTML views, PDF and ePub downloads, according to the available data) and Abstracts Views on Vision4Press platform.
Data correspond to usage on the plateform after 2015. The current usage metrics is available 48-96 hours after online publication and is updated daily on week days.
Initial download of the metrics may take a while.