Fig. 6
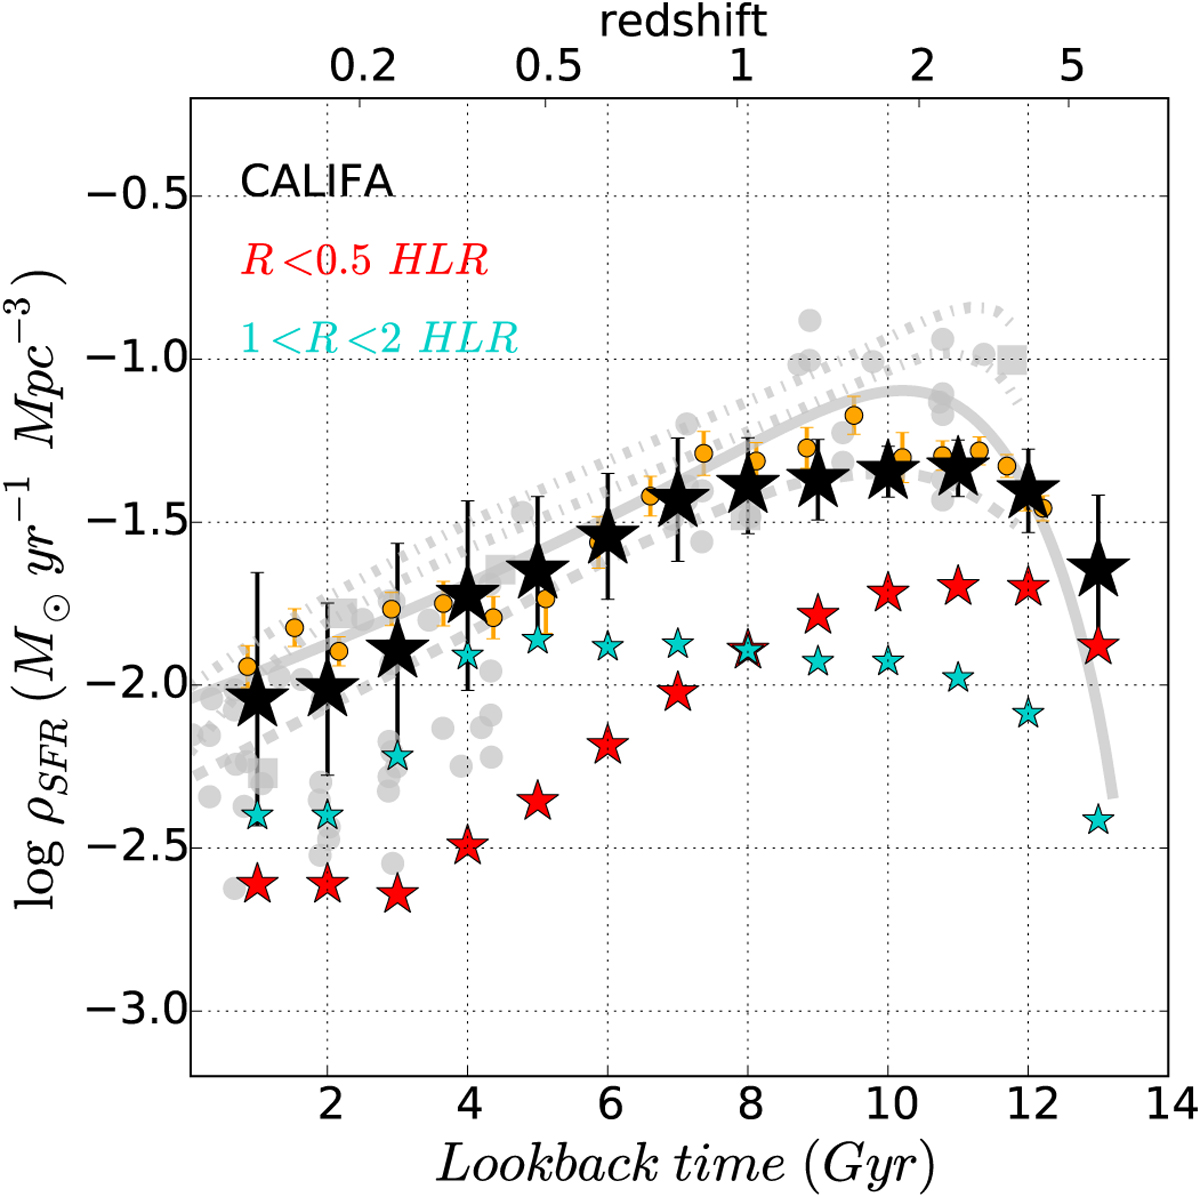
Cosmic evolution of the SFR density, ρSFR, in this study (black stars). Blue and red stars represent the contribution to ρSFR of the regions between 1 and 2 HLR and within the inner 0.5 HLR, respectively. Other results are from recent determinations by Gunawardhana et al. (2013, 2015) and their compilation (gray points), and the redshift evolution of ρSFR from Hopkins & Beacom (2006; the top two gray dotted lines are ± 1σ of their relation); Madau & Dickinson (2014; middle gray full line); Fardal et al. (2007; bottom gray dashed line); from the fossil record method applied to SDSS data by Panter et al. (2003; gray squares); and from the work of Driver et al. (2017) for data from GAMA, G10-COSMOS, and 3D-HST (orange dots). When needed, literature values have been scaled to a Chabrier IMF.
Current usage metrics show cumulative count of Article Views (full-text article views including HTML views, PDF and ePub downloads, according to the available data) and Abstracts Views on Vision4Press platform.
Data correspond to usage on the plateform after 2015. The current usage metrics is available 48-96 hours after online publication and is updated daily on week days.
Initial download of the metrics may take a while.