Fig. 11
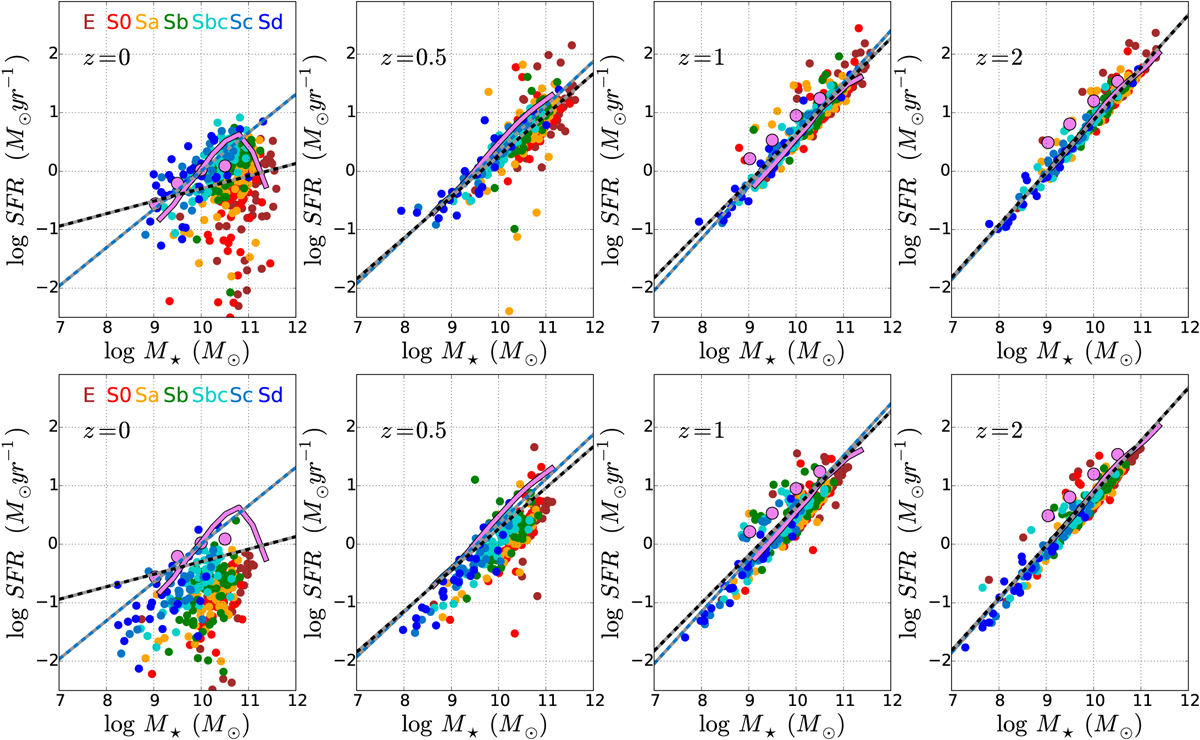
Upper panels: evolution of MSSF from z = 2 (right panel) to z = 0 (left panel). Galaxies are color-coded according to morphology. Lower panels: same as in the upper panels, but using only the contributions to SFR and M⋆ of the present-day galaxy inner regions (R ≤ 0.5 HLR). Blue-gray and black-gray lines (in upper and lower panels) are fits to log SFR − log M⋆ for Sc and for all the galaxies in this study. Large purple dots are from the compilation by Behroozi et al. (2013), and the purple line is the MSSF from the Illustris simulation by Sparre et al. (2015) and Tomczak et al. (2016).
Current usage metrics show cumulative count of Article Views (full-text article views including HTML views, PDF and ePub downloads, according to the available data) and Abstracts Views on Vision4Press platform.
Data correspond to usage on the plateform after 2015. The current usage metrics is available 48-96 hours after online publication and is updated daily on week days.
Initial download of the metrics may take a while.