Free Access
Fig. 6
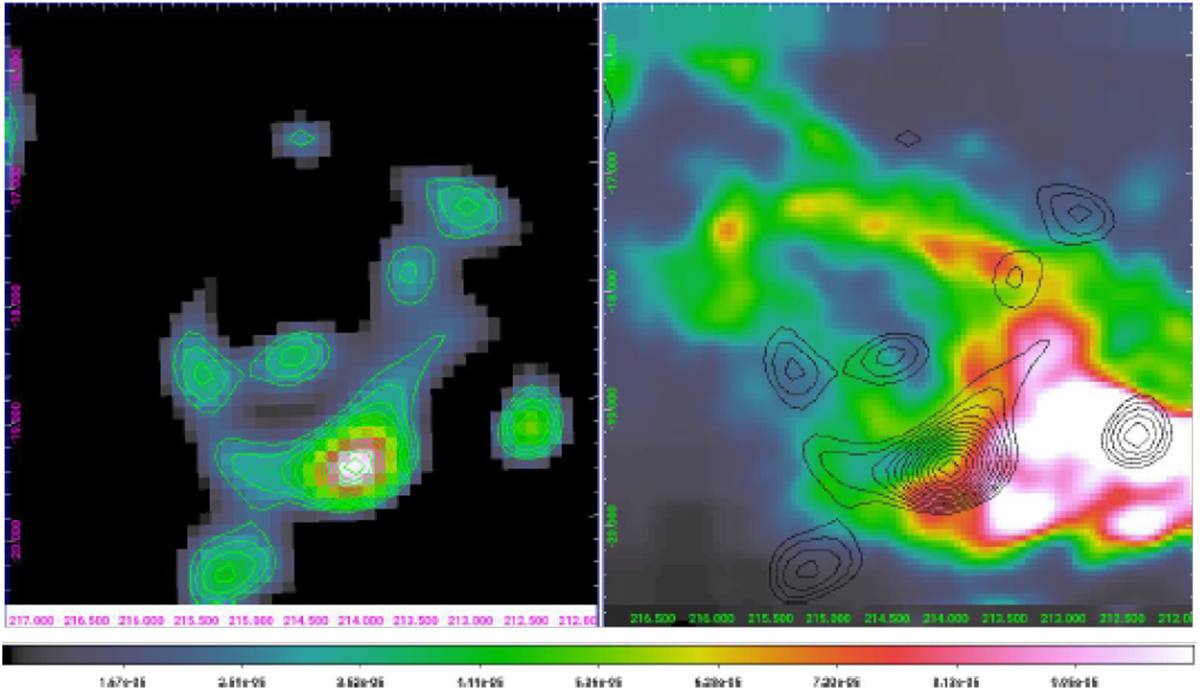
Left panel: ring of γ-ray excess detected by AGILE. Right panel: CO map from Dame et al. (2001), which reveals the star-forming shell discussed by Pillitteri et al. (2016). The contour levels from the γ-ray data are shown in black.
Current usage metrics show cumulative count of Article Views (full-text article views including HTML views, PDF and ePub downloads, according to the available data) and Abstracts Views on Vision4Press platform.
Data correspond to usage on the plateform after 2015. The current usage metrics is available 48-96 hours after online publication and is updated daily on week days.
Initial download of the metrics may take a while.