Free Access
Fig. 1
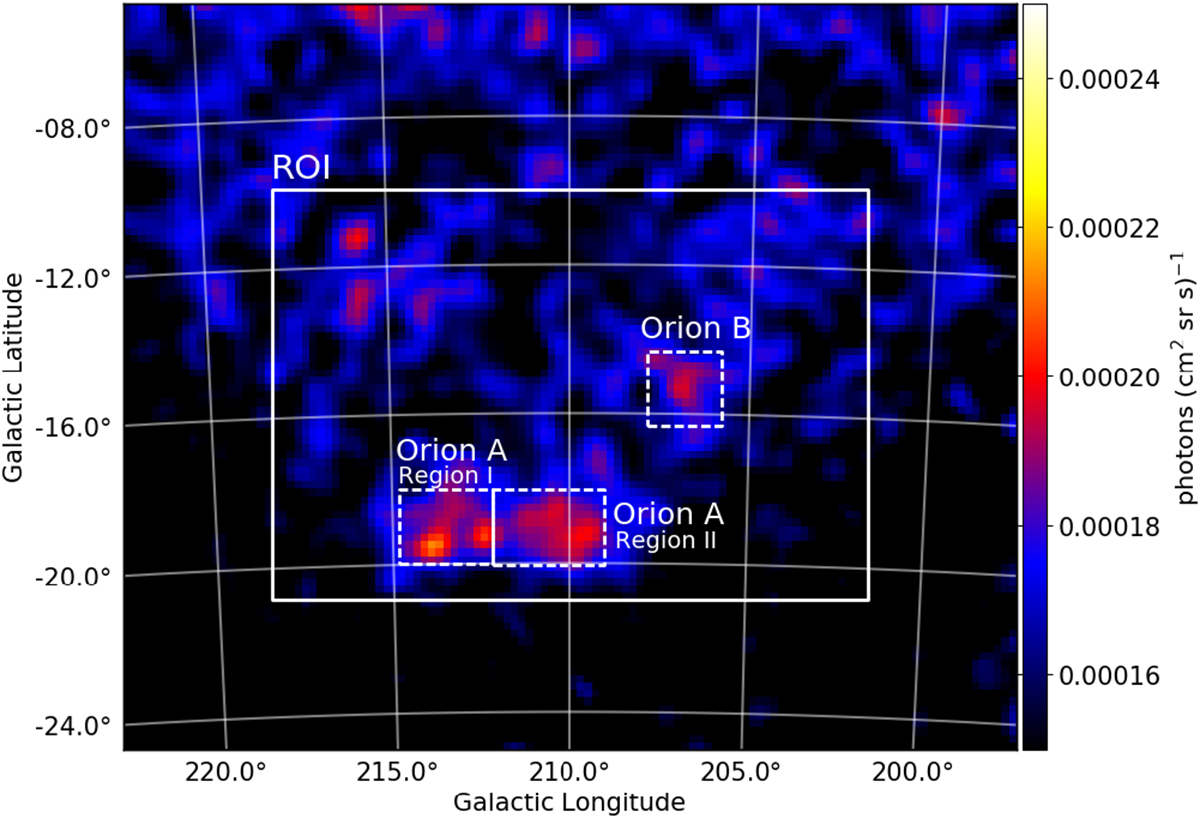
AGILE map of Orion. The large continuous rectangle highlights the region of interest over which the best fit model was computed. From left to right, the dashed rectangles show the Region I and Region II subregions of Orion A, and Orion B.
Current usage metrics show cumulative count of Article Views (full-text article views including HTML views, PDF and ePub downloads, according to the available data) and Abstracts Views on Vision4Press platform.
Data correspond to usage on the plateform after 2015. The current usage metrics is available 48-96 hours after online publication and is updated daily on week days.
Initial download of the metrics may take a while.