Fig. 7
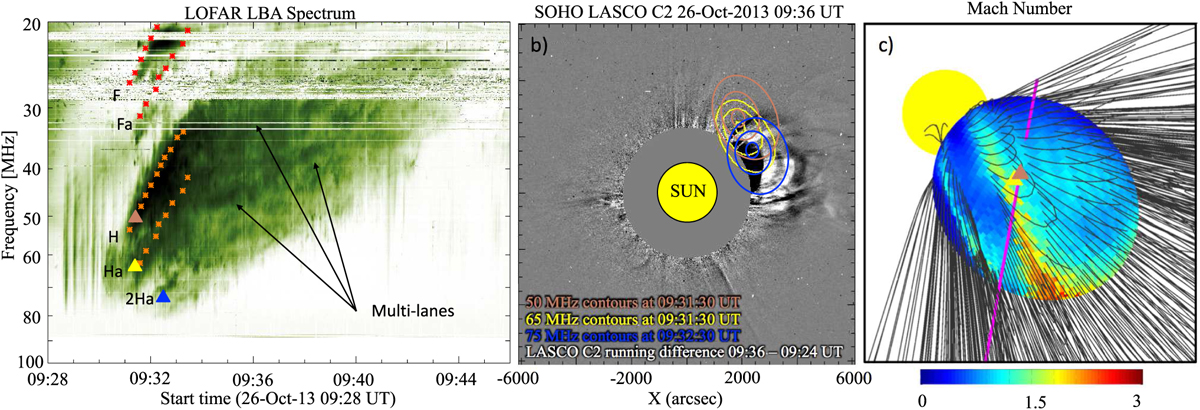
Panel a: dynamic spectrum of the type II radio burst observed on 2013 Oct 26, showing band-splitting in both the fundamental (F and Fa) and the harmonic lanes (H and Ha) and a series of multi-lanes (indicated by the black arrows). The second harmonic emission can also be seen and is marked with 2Ha. The location of the radio sources for the two split-lanes resolved for 50 and 65 MHz at 09:31:30 UT are indicated in the dynamic spectrum by the brown and yellow triangles, respectively. The second harmonic of the type II radio burst is indicated at 75 MHzwith the blue triangle. Panel b: running-difference image of the CME observed with SOHO/LASCO (09:36−09:24 UT) with superposed contours of the radio sources (80%, 90%, and 95%) of the two split lanes H and Ha at 09:31:30 UT. The source location of the second harmonic at 09:32:45 using the colour code of the triangles in panel a is also shown. Panel c: reconstructed CME Mach number. The locations of the type II split-lanes are superposed. The LOS is indicated bythe purple line.
Current usage metrics show cumulative count of Article Views (full-text article views including HTML views, PDF and ePub downloads, according to the available data) and Abstracts Views on Vision4Press platform.
Data correspond to usage on the plateform after 2015. The current usage metrics is available 48-96 hours after online publication and is updated daily on week days.
Initial download of the metrics may take a while.