Fig. 3
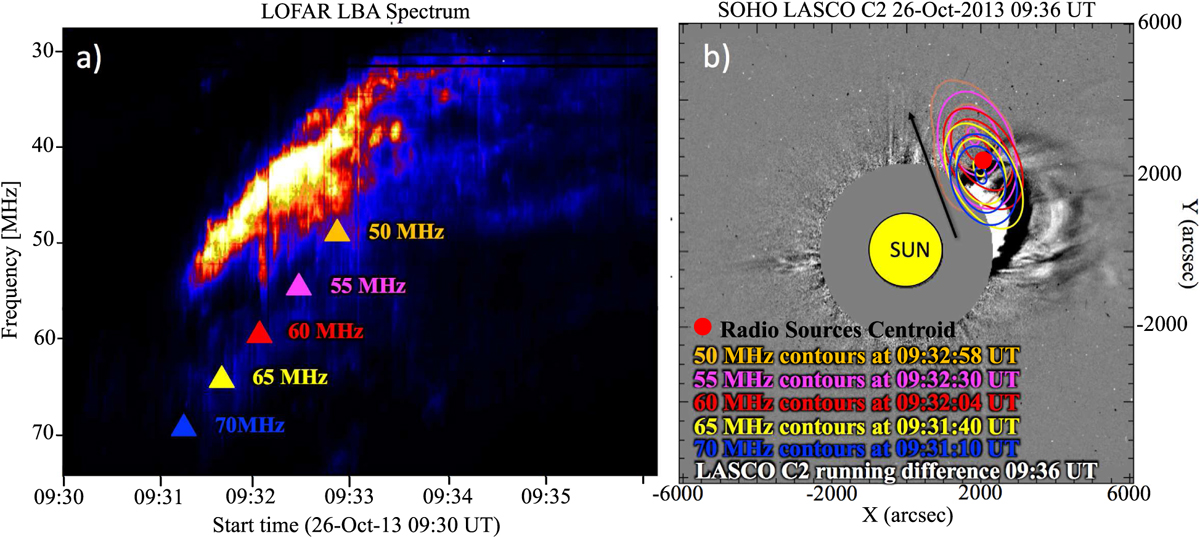
Panel a: dynamic spectrum of the type II radio burst observed on 2013 Oct 26; the harmonic emission is visible from 70 to ~30 MHz. The specific times and frequencies at which the location of the radio source is calculated are indicated with coloured triangles. Panel b: running-difference image of the CME observed with SOHO/LASCO (09:36−09:24 UT) with superposed contours of the radio sources (80%, 90%, and 95%) using the same colour code as for the triangles in panel a.
Current usage metrics show cumulative count of Article Views (full-text article views including HTML views, PDF and ePub downloads, according to the available data) and Abstracts Views on Vision4Press platform.
Data correspond to usage on the plateform after 2015. The current usage metrics is available 48-96 hours after online publication and is updated daily on week days.
Initial download of the metrics may take a while.