Fig. 1
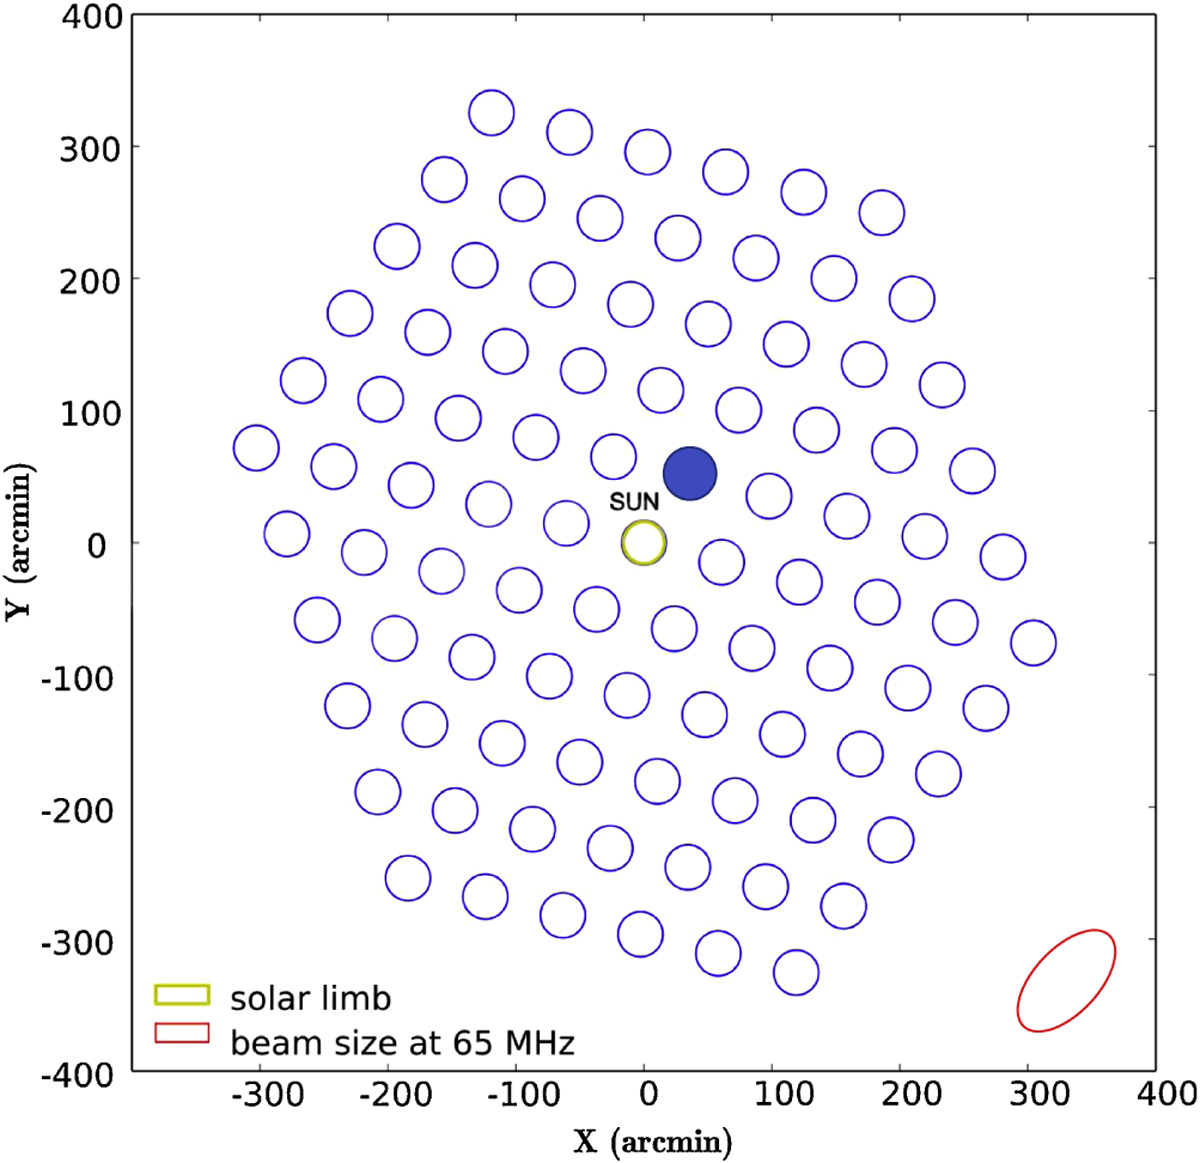
Map of 91 tied-array beams covering a field of view of ~16 R⊙ centred on the Sun. The FWHM of the beam at a frequency of 65 MHz is represented by the red circle, and the size of the optical Sun is represented by the yellow circle. The blue filled dot is the location of the beam at which the dynamic spectrum of Fig. 2 was obtained.
Current usage metrics show cumulative count of Article Views (full-text article views including HTML views, PDF and ePub downloads, according to the available data) and Abstracts Views on Vision4Press platform.
Data correspond to usage on the plateform after 2015. The current usage metrics is available 48-96 hours after online publication and is updated daily on week days.
Initial download of the metrics may take a while.