Fig. 21
Download original image
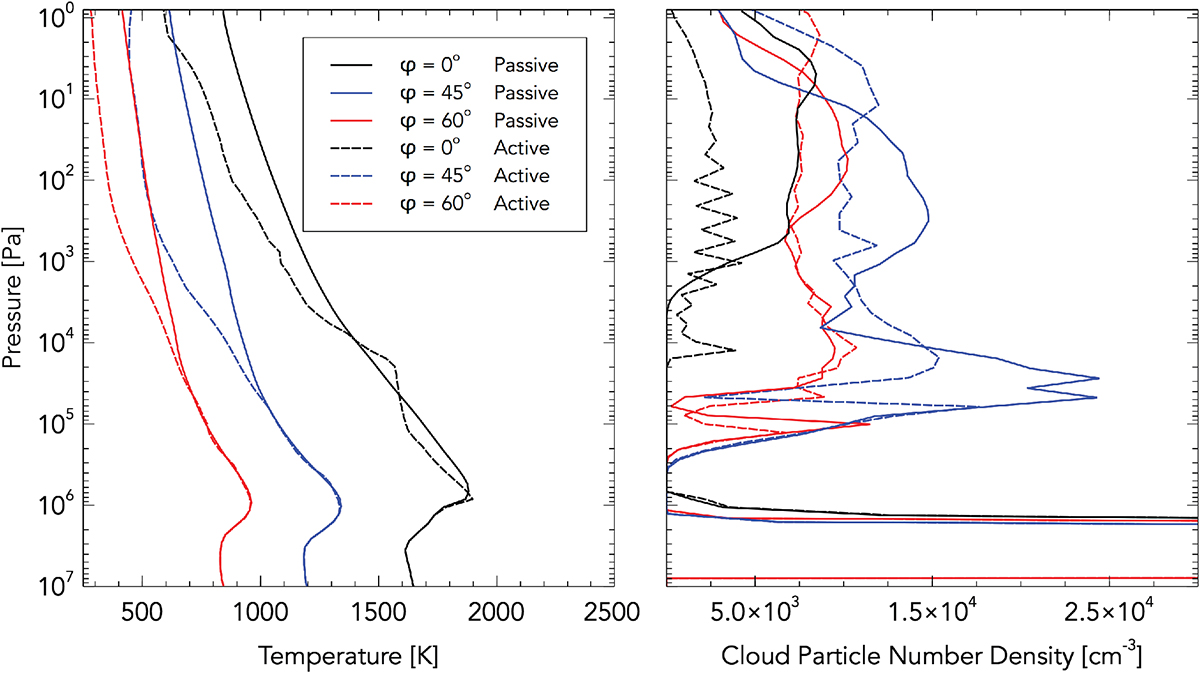
Longitudinally averaged gas temperature [K] (left) and particle number density (right) for the standard HD 209458 b model at the end of the transparent cloud stage at tcloud = 50 days (see Table 1 and Sect. 2.6) and the radiatively active stage at tcloud = 100 days. For each time, three profiles are plotted that cover latitudes of ϕ = 0° (black), ϕ = 45° (blue), and ϕ = 90° (red).
Current usage metrics show cumulative count of Article Views (full-text article views including HTML views, PDF and ePub downloads, according to the available data) and Abstracts Views on Vision4Press platform.
Data correspond to usage on the plateform after 2015. The current usage metrics is available 48-96 hours after online publication and is updated daily on week days.
Initial download of the metrics may take a while.