Fig. 17
Download original image
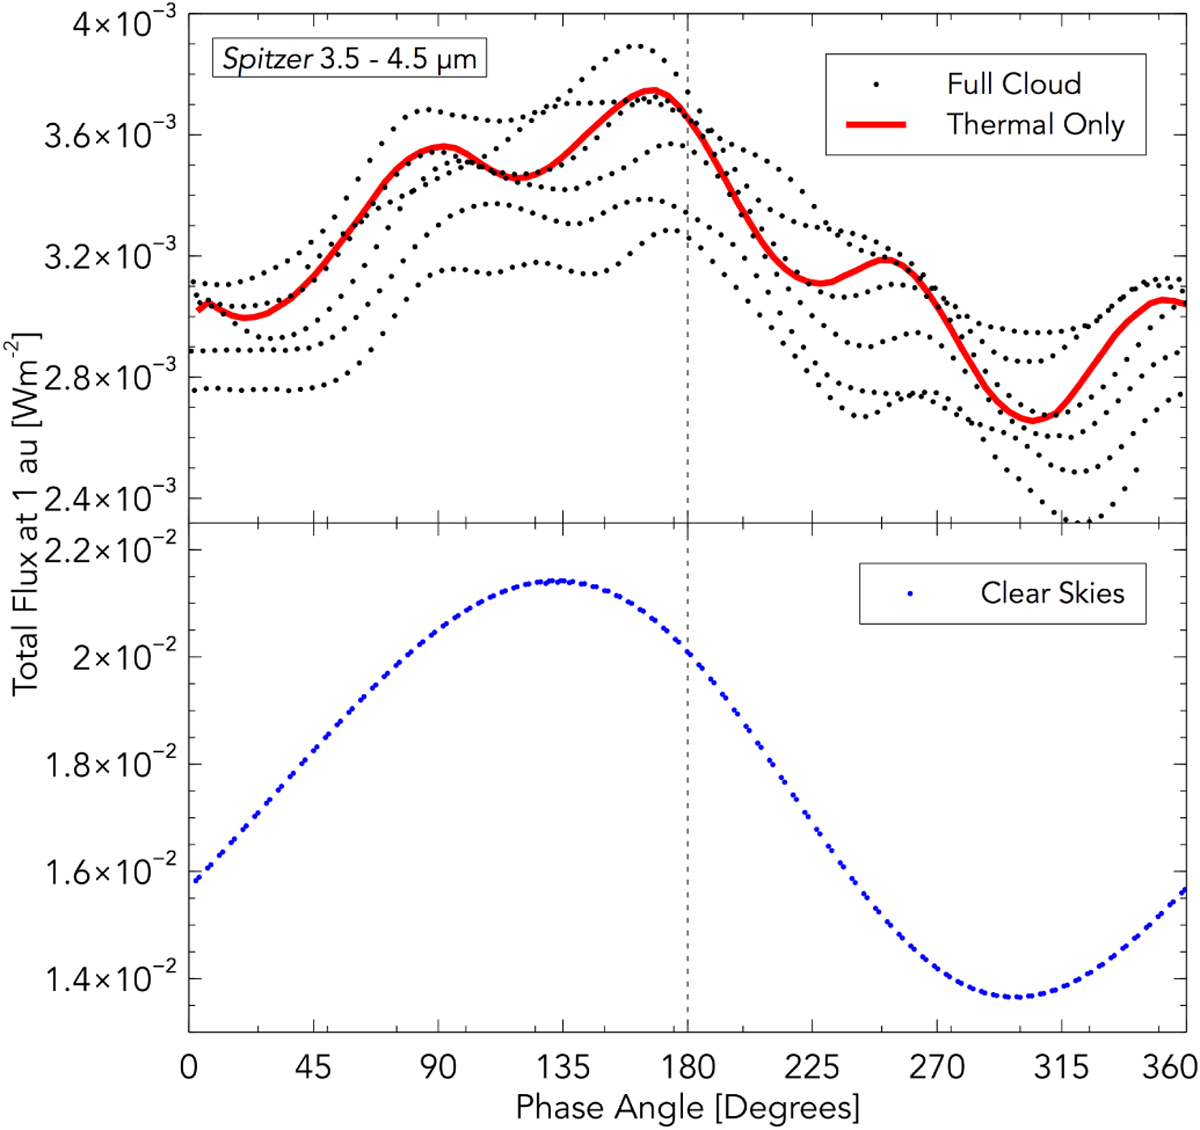
Phase curves of the active, cloudy, hot HD 209458 b simulation for flux at 1 au received between 3.5 and 4.5 μm. Black dots correspond to six complete orbits after the simulation end at tcloud = 100 days. The red line is the flux from the thermal emission of the atmosphere only and is to be compared with the first orbit (uppermost black dots), and does not included reflected stellar flux.
Current usage metrics show cumulative count of Article Views (full-text article views including HTML views, PDF and ePub downloads, according to the available data) and Abstracts Views on Vision4Press platform.
Data correspond to usage on the plateform after 2015. The current usage metrics is available 48-96 hours after online publication and is updated daily on week days.
Initial download of the metrics may take a while.