Free Access
Fig. 16
Download original image
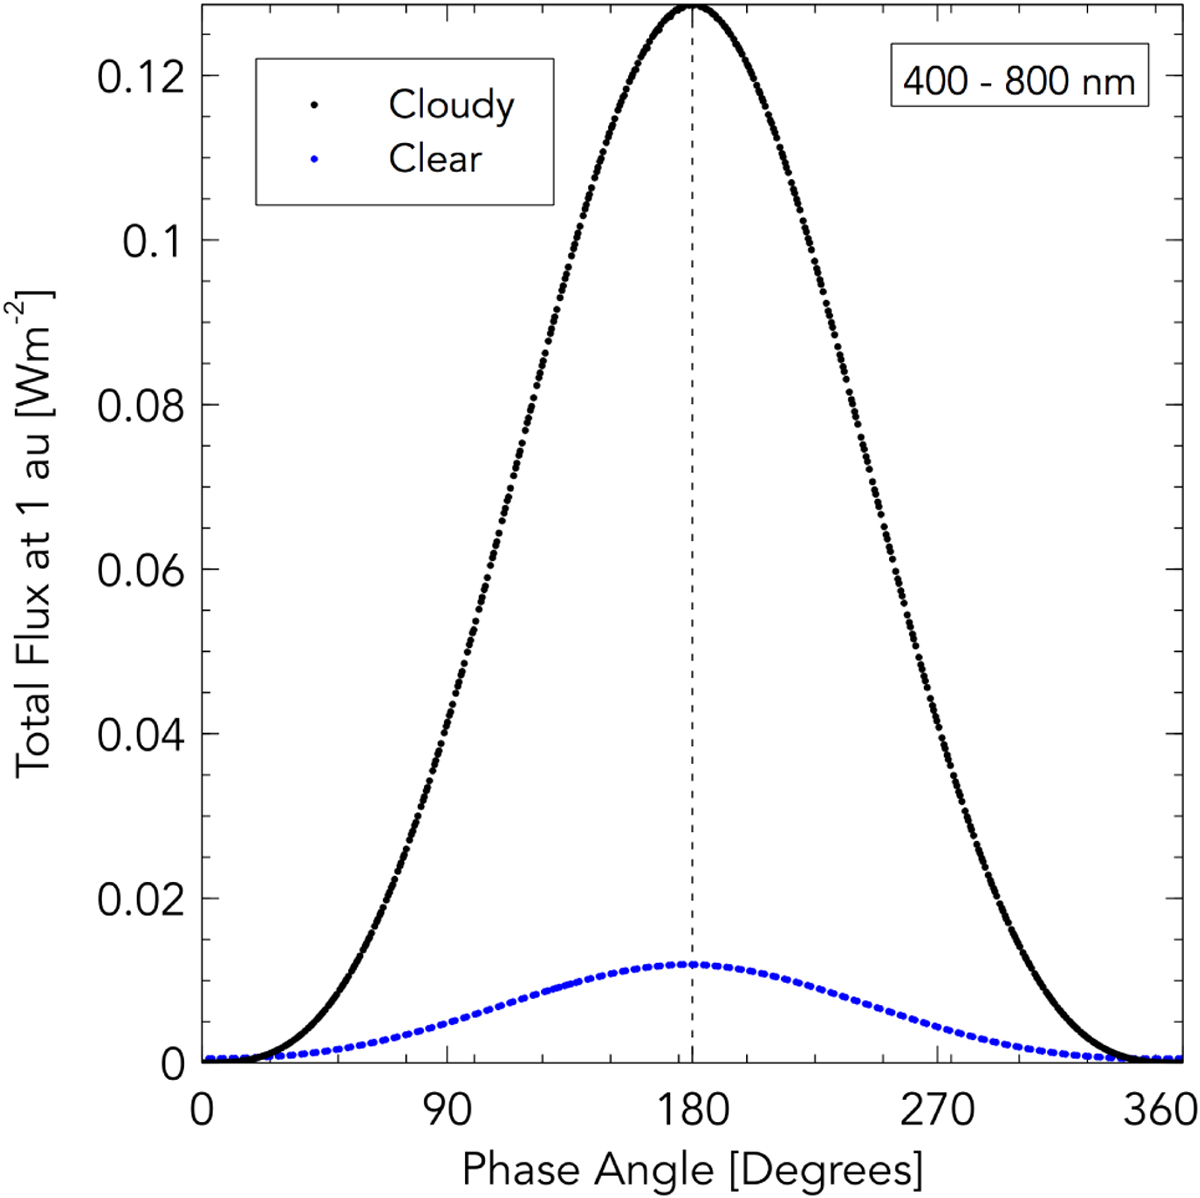
Visual phase curve of the active, cloudy, hot HD 209458 b simulation for flux at 1 au received in the Kepler bandpass between 400 and 800 nm. Black points correspond to six complete orbits after the simulation end at tcloud = 100 days (see Table 1 and Sect. 2.6). Blue points follow the flux from a cloud free simulation.
Current usage metrics show cumulative count of Article Views (full-text article views including HTML views, PDF and ePub downloads, according to the available data) and Abstracts Views on Vision4Press platform.
Data correspond to usage on the plateform after 2015. The current usage metrics is available 48-96 hours after online publication and is updated daily on week days.
Initial download of the metrics may take a while.