Fig. 9
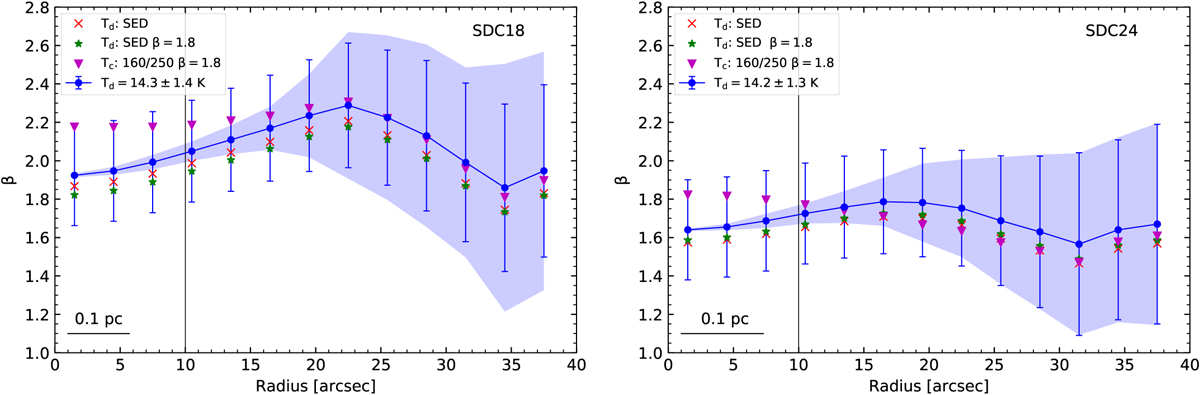
Radial profiles of β measured in SDC18 and SDC24. In each case, the blue lines show the mean value of β in the annuli centred on each point, and the shaded blue regions show the standard deviation of pixelvalues within the corresponding annulus. The error bars combine the uncertainties from calibration, noise and temperature uncertainty. The solid black line at a radius of 10′′ shows the extent of the effective beam. The profiles shown as red crosses, green stars and magenta triangles arise from adoption of the different temperature maps used as described in Sect. 3.4.
Current usage metrics show cumulative count of Article Views (full-text article views including HTML views, PDF and ePub downloads, according to the available data) and Abstracts Views on Vision4Press platform.
Data correspond to usage on the plateform after 2015. The current usage metrics is available 48-96 hours after online publication and is updated daily on week days.
Initial download of the metrics may take a while.