Fig. 8
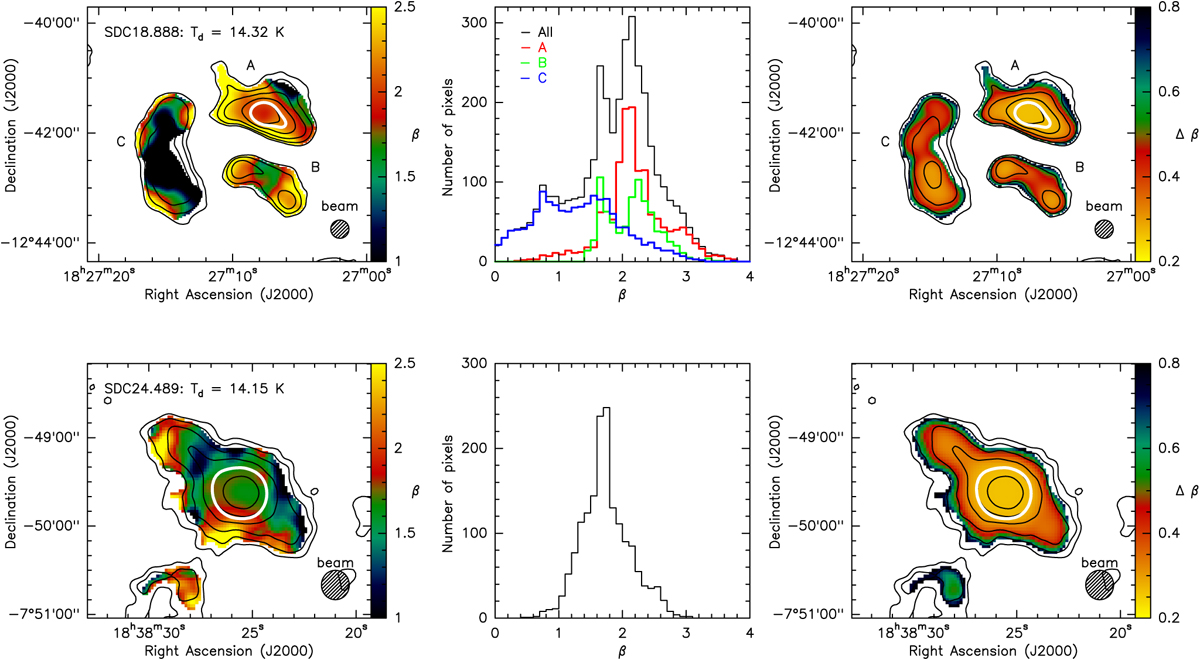
Maps of the dust emissivity spectral index β for SDC18 (top row) and SDC24 (bottom row) with the corresponding histograms in the central column, and the associated total uncertainty maps (including both random and systematic contributions) in the right column. The black contours show the 2.0 mm emission as in Fig. 1, while the white contours show where the 1.2 mm S/N is equal to 25, above which we can expect the random contribution of the noise to the value of β to be Δβ < 0.1. The 20′′ effective beam sizes are shown for scale.
Current usage metrics show cumulative count of Article Views (full-text article views including HTML views, PDF and ePub downloads, according to the available data) and Abstracts Views on Vision4Press platform.
Data correspond to usage on the plateform after 2015. The current usage metrics is available 48-96 hours after online publication and is updated daily on week days.
Initial download of the metrics may take a while.