Fig. 5
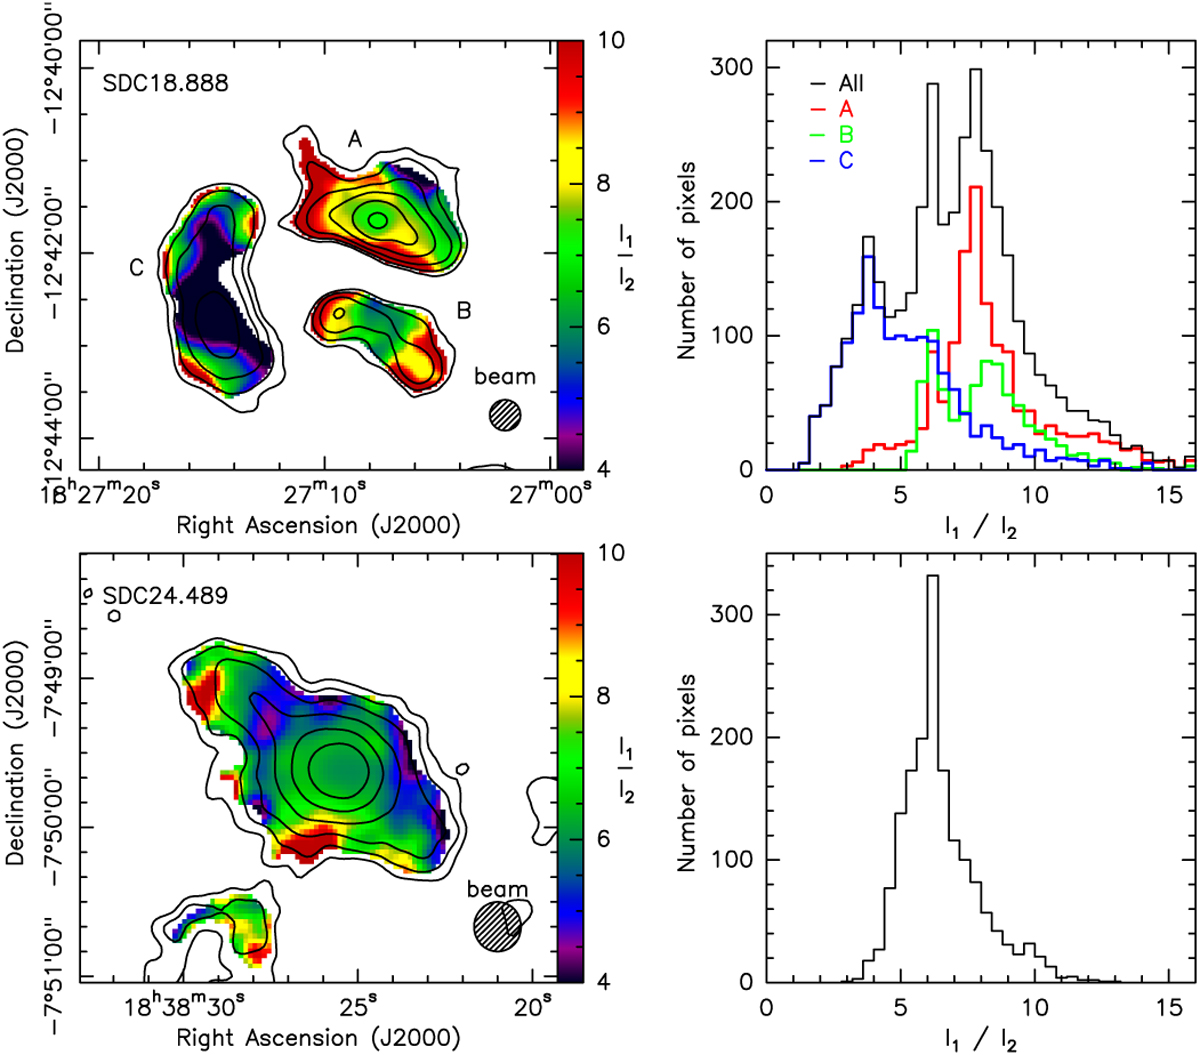
Maps of the 1.2 to 2.0 mm intensity ratio for SDC18 (top) and SDC24 (bottom) at 20′′ resolution, along with histograms of the pixel values in the regions shown. The contours show the 2.0 mm emission after smoothing to 20′′ resolution, in terms of the S/N, beginning at the S∕N = 2 level and increasing by a factor of two with each step.
Current usage metrics show cumulative count of Article Views (full-text article views including HTML views, PDF and ePub downloads, according to the available data) and Abstracts Views on Vision4Press platform.
Data correspond to usage on the plateform after 2015. The current usage metrics is available 48-96 hours after online publication and is updated daily on week days.
Initial download of the metrics may take a while.