Fig. B.1
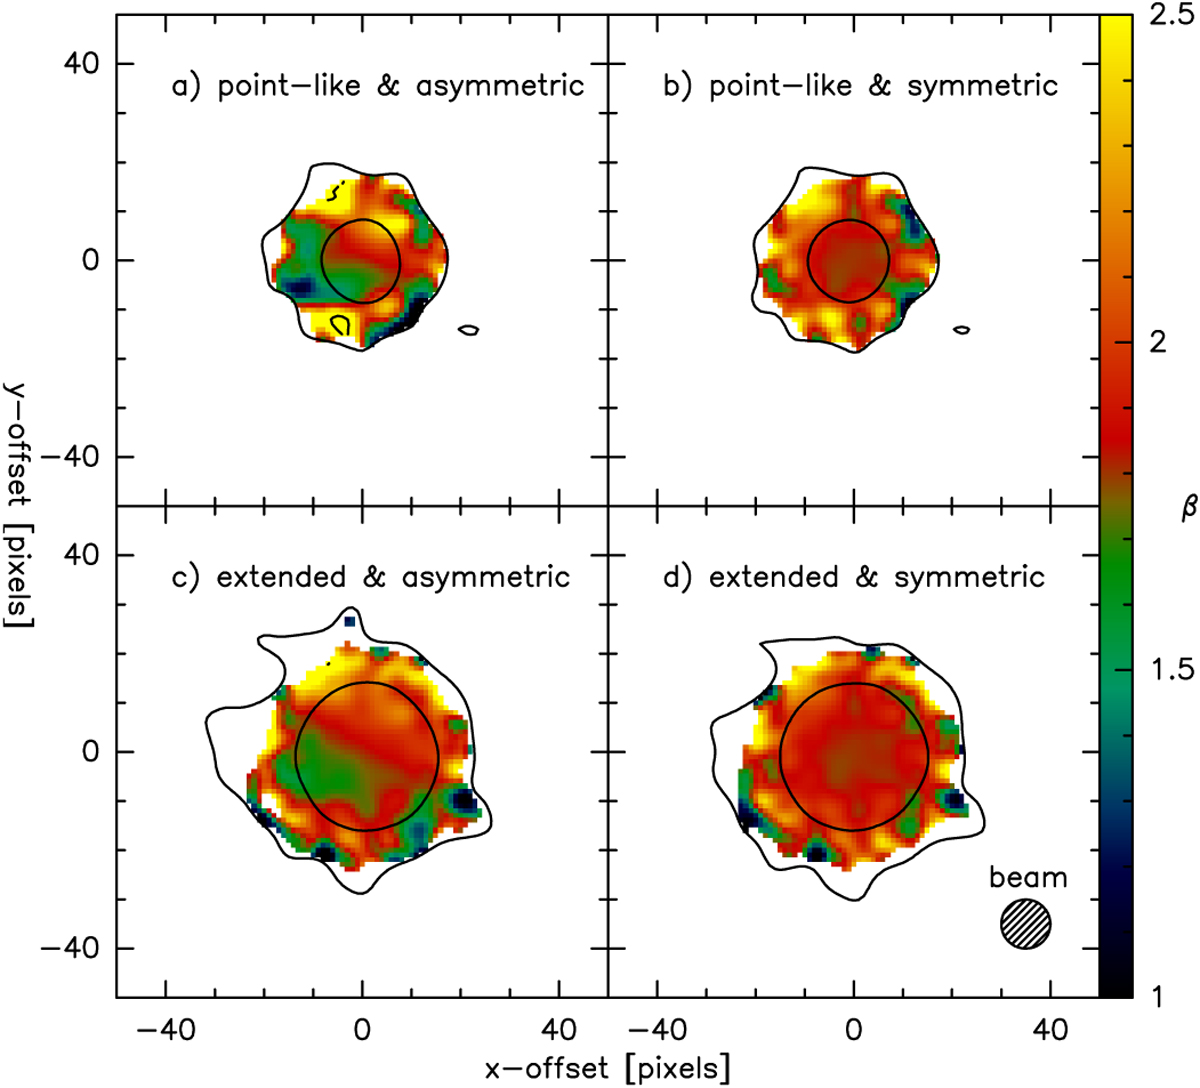
Synthetic β maps generated for two separate models: a) and b) are generated for a point source and c) and d) are generated for a source with a Gaussian intensity profile with a FWHM of 19′′. Panels a and c have been generated by convolution of the source with a Uranus beam map, while panels b and d were convolved with the beam map after azimuthal averaging. The effective beam size is given in the lower-right of panel d, and the contours represent S/N levels of 3 and 25 from the 1.2 mm image.
Current usage metrics show cumulative count of Article Views (full-text article views including HTML views, PDF and ePub downloads, according to the available data) and Abstracts Views on Vision4Press platform.
Data correspond to usage on the plateform after 2015. The current usage metrics is available 48-96 hours after online publication and is updated daily on week days.
Initial download of the metrics may take a while.