Free Access
Fig. A.1
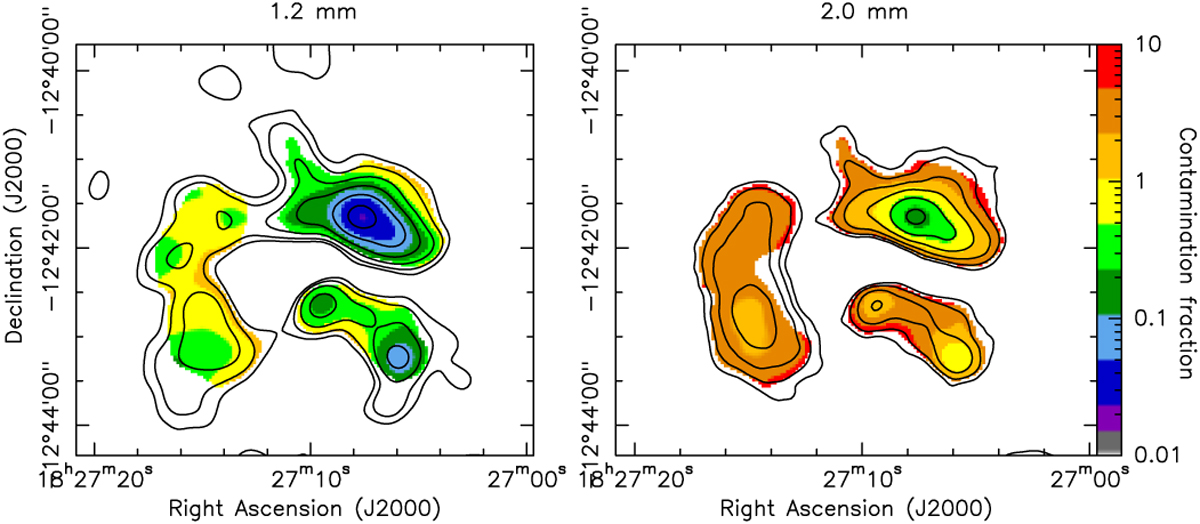
Maps of the free–free contamination fraction at 1.2 and 2.0 mm, derived from the 20 cm MAGPIS data assuming an optically thin H II region. The black contours overlaid are from the corresponding NIKA maps at 20" resolution, and identical to those displayed in Fig. 5.
Current usage metrics show cumulative count of Article Views (full-text article views including HTML views, PDF and ePub downloads, according to the available data) and Abstracts Views on Vision4Press platform.
Data correspond to usage on the plateform after 2015. The current usage metrics is available 48-96 hours after online publication and is updated daily on week days.
Initial download of the metrics may take a while.