Free Access
Fig. 13
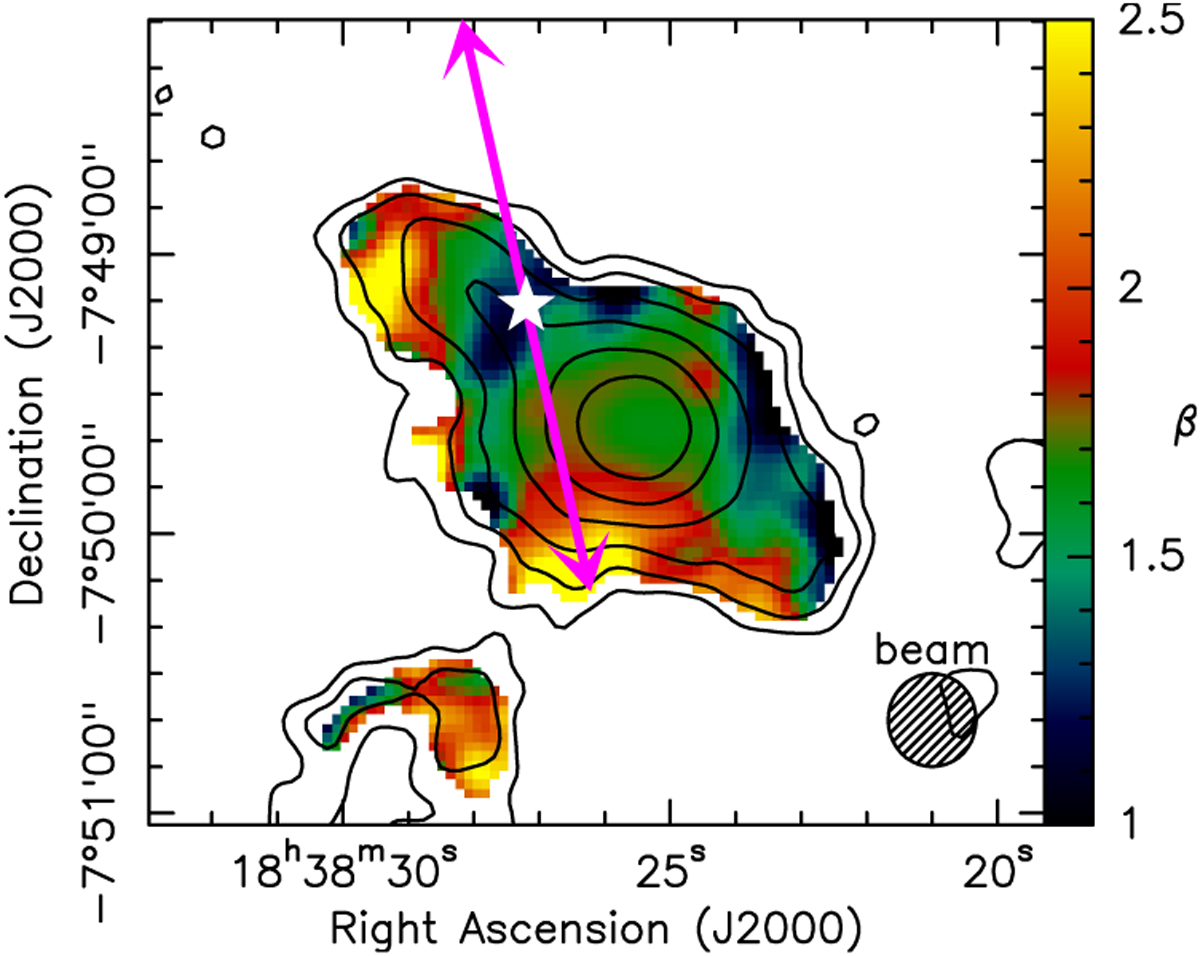
β map for SDC24 overlaid with the location of MHO 3240 – the driving source candidate (white star) – associated with the molecular hydrogen outflows (magenta arrows) identified by Ioannidis & Froebrich (2012). The contours show the 2.0 mm S/Nas in Fig. 5.
Current usage metrics show cumulative count of Article Views (full-text article views including HTML views, PDF and ePub downloads, according to the available data) and Abstracts Views on Vision4Press platform.
Data correspond to usage on the plateform after 2015. The current usage metrics is available 48-96 hours after online publication and is updated daily on week days.
Initial download of the metrics may take a while.