Fig. 11
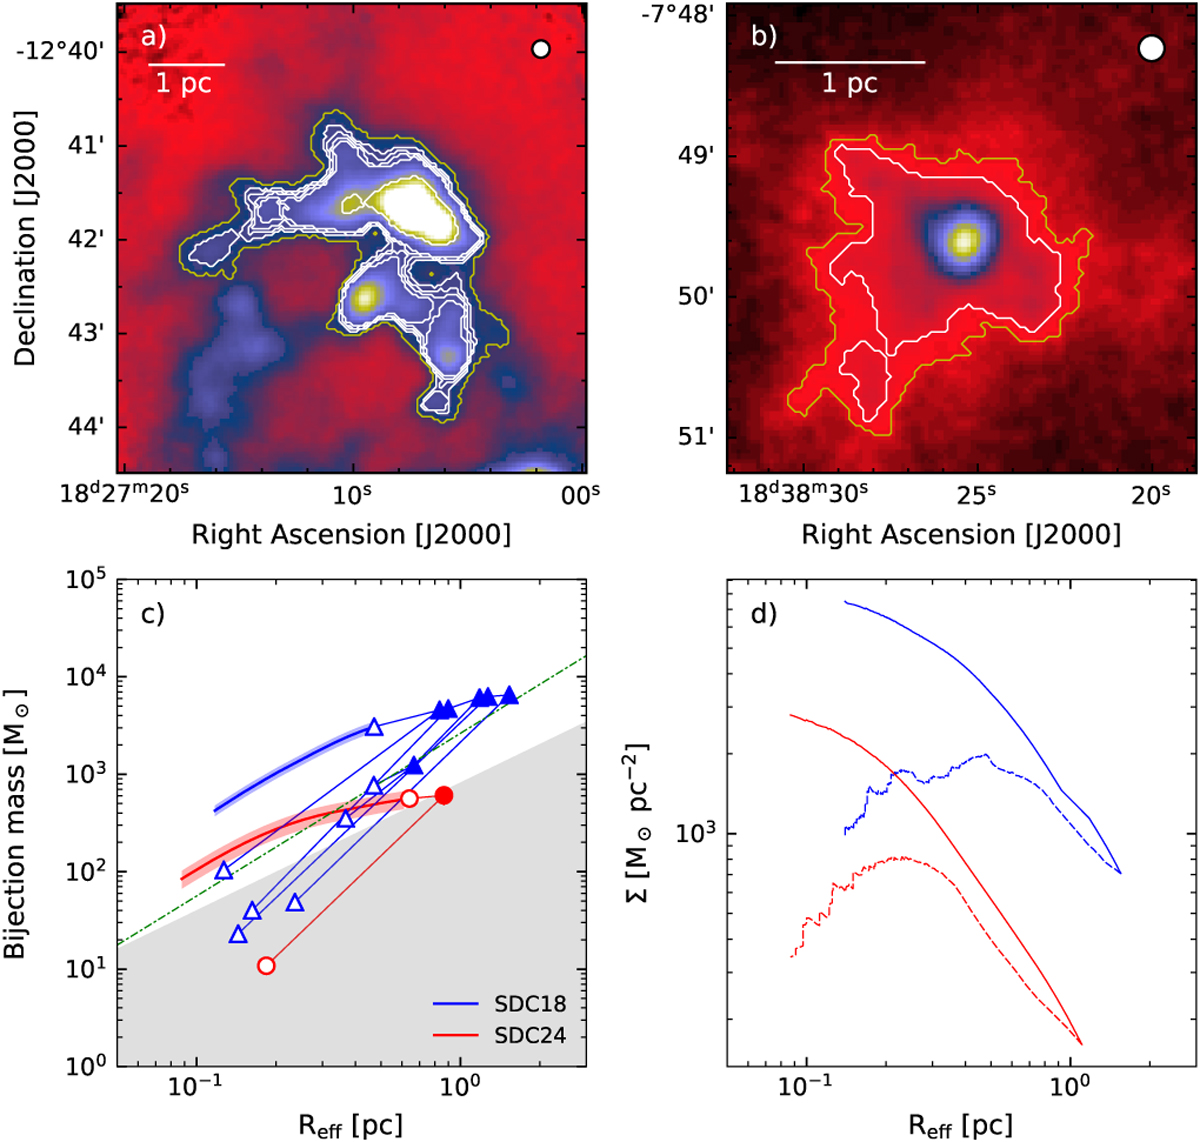
Panels a and b: contours that determine the boundaries of the dendrogram substructures within SDC18 and SDC24, respectively, with leaves and branches shown in white and the IRDC boundaries shown in yellow. The underlying image shows the combined-resolution column density map from Fig. 10. Panel c: enclosed (bijection) masses of the dendrogram substructures as a function of the effective radius,
![]() , for SDC18 in blue triangles and SDC24 in red circles with filled points showing the dendrogram “branches” and empty points corresponding to the “leaves”. The solid red and blue lines connect each substructure to its parent, where applicable. The shadedregion defines objects that do not satisfy the Kauffmann & Pillai (2010) criterion for HMSF clumps,
, for SDC18 in blue triangles and SDC24 in red circles with filled points showing the dendrogram “branches” and empty points corresponding to the “leaves”. The solid red and blue lines connect each substructure to its parent, where applicable. The shadedregion defines objects that do not satisfy the Kauffmann & Pillai (2010) criterion for HMSF clumps,
![]() . The dot-dashed green line shows the mass-radius relation calculated for ATLASGAL clumps that exhibit signs of ongoing high-mass star formation (Urquhart et al. 2014) with
. The dot-dashed green line shows the mass-radius relation calculated for ATLASGAL clumps that exhibit signs of ongoing high-mass star formation (Urquhart et al. 2014) with
![]() . The solid blue and red lines show the mass distributions inside the boundary of the most massive leaf in each IRDC, with uncertainties shown by the corresponding shaded areas. Panel d: mean surface density as a function of radius for all contour levels in each cloud that lead to the most massive clumps. The solid and dashed lines represent upper limits, calculated from the bijection and clipping methods, respectively.
. The solid blue and red lines show the mass distributions inside the boundary of the most massive leaf in each IRDC, with uncertainties shown by the corresponding shaded areas. Panel d: mean surface density as a function of radius for all contour levels in each cloud that lead to the most massive clumps. The solid and dashed lines represent upper limits, calculated from the bijection and clipping methods, respectively.
Current usage metrics show cumulative count of Article Views (full-text article views including HTML views, PDF and ePub downloads, according to the available data) and Abstracts Views on Vision4Press platform.
Data correspond to usage on the plateform after 2015. The current usage metrics is available 48-96 hours after online publication and is updated daily on week days.
Initial download of the metrics may take a while.