Fig. 10
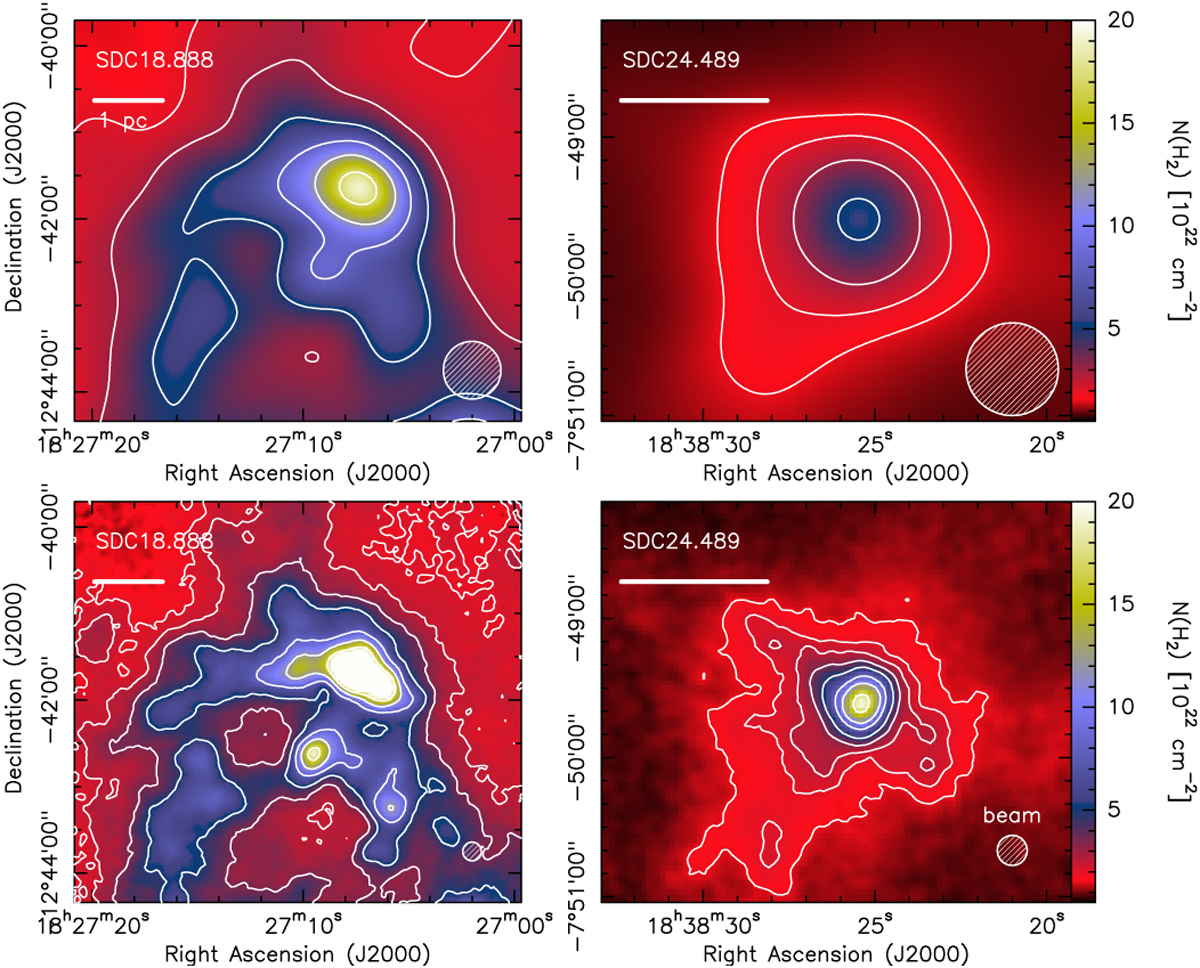
Column density maps for SDC18 (left column) and SDC24 (right column), calculated assuming a single β value in each IRDC. The maps on the top row were generated by smoothing Hi-GAL imaging to a common resolution of 40′′, while those on the bottom utilise the multi-resolution technique, sampling between 40′′ and 13′′ to combine both Herschel and NIKA data. The SDC18 contours show column densities levels of 2.0, 3.5, 5.0, 8.0, 12.0, 17.0 and 23.0 × 1022 cm−2, and the SDC24 are the same with an additional contour at 1.5 × 1022 cm−2. Scale bars showing a 1 pc distance are displayed in the top left of each panel.
Current usage metrics show cumulative count of Article Views (full-text article views including HTML views, PDF and ePub downloads, according to the available data) and Abstracts Views on Vision4Press platform.
Data correspond to usage on the plateform after 2015. The current usage metrics is available 48-96 hours after online publication and is updated daily on week days.
Initial download of the metrics may take a while.