Fig. 5
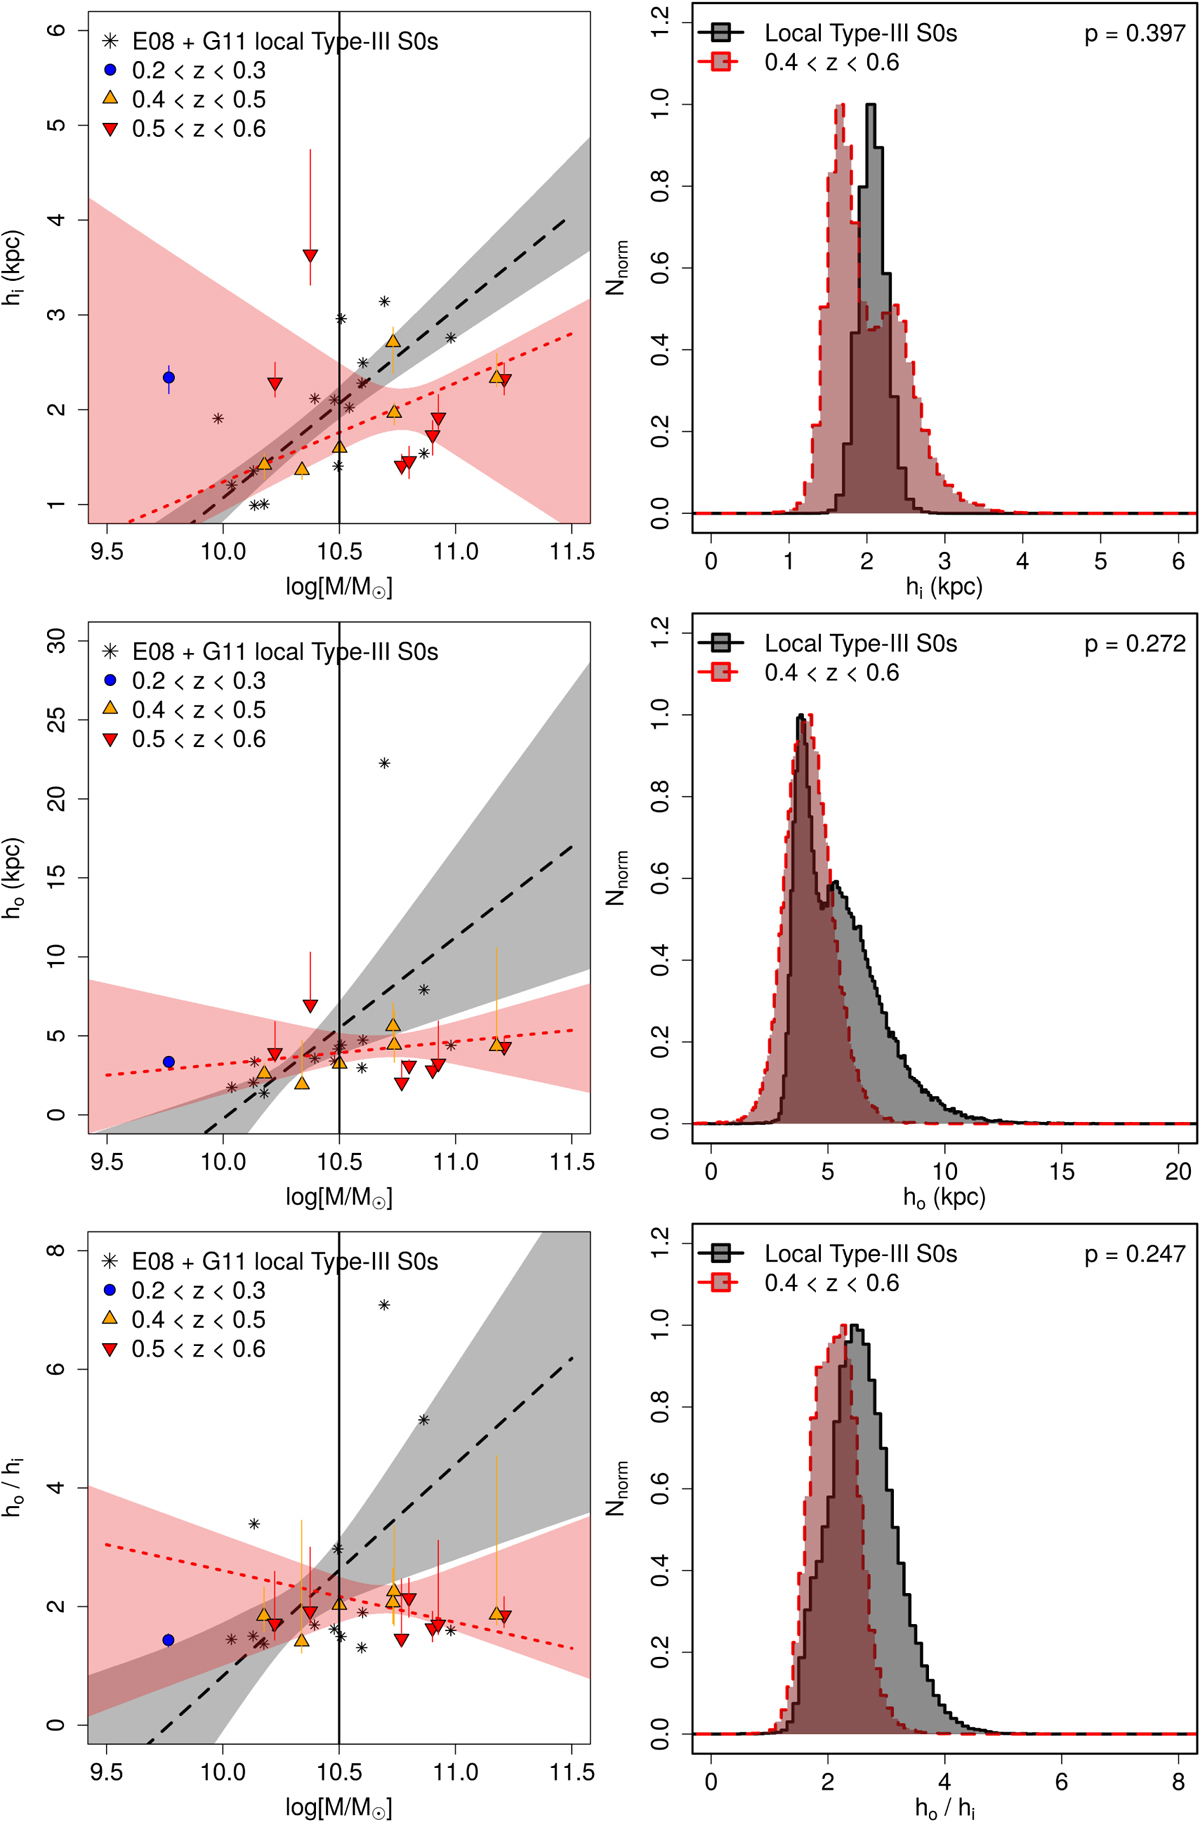
Scale-lengths of the inner (hi, top row) andouter profiles (ho, middle row) and the ratio ho/hi (bottom row) as a function of the stellar mass. Left column: distribution of hi, ho and ho /hi of Type-III S0 galaxies at 0.2 < z < 0.6 and at z ~ 0 with the stellar mass. The solid vertical black lines in the left panel represent the fixed value at which we compare the linear fits in the right one. Right column: comparison of the PDDs of the scale lengths hi, ho and the ratio ho /hi at fixed stellar mass log10(M∕M⊙) = 10.5. Grey histogram with black solid line: PDDs for the Type-III S0 galaxies in the local Universe selected from E08 and G11 samples. Red histogram with dashed line: PDDs for the Type-III S0 galaxies at 0.4 < z < 0.6 from the SHARDS sample. The probabilities (p-value) for both samples to have compatible values at fixed stellar mass of log10(M∕M⊙) = 10.5 are p = 0.397 (hi), p = 0.272 (ho) and p = 0.247 (ho /hi). We refer to the legend in the panels for a key of the different lines and symbols.
Current usage metrics show cumulative count of Article Views (full-text article views including HTML views, PDF and ePub downloads, according to the available data) and Abstracts Views on Vision4Press platform.
Data correspond to usage on the plateform after 2015. The current usage metrics is available 48-96 hours after online publication and is updated daily on week days.
Initial download of the metrics may take a while.