Fig. B.1
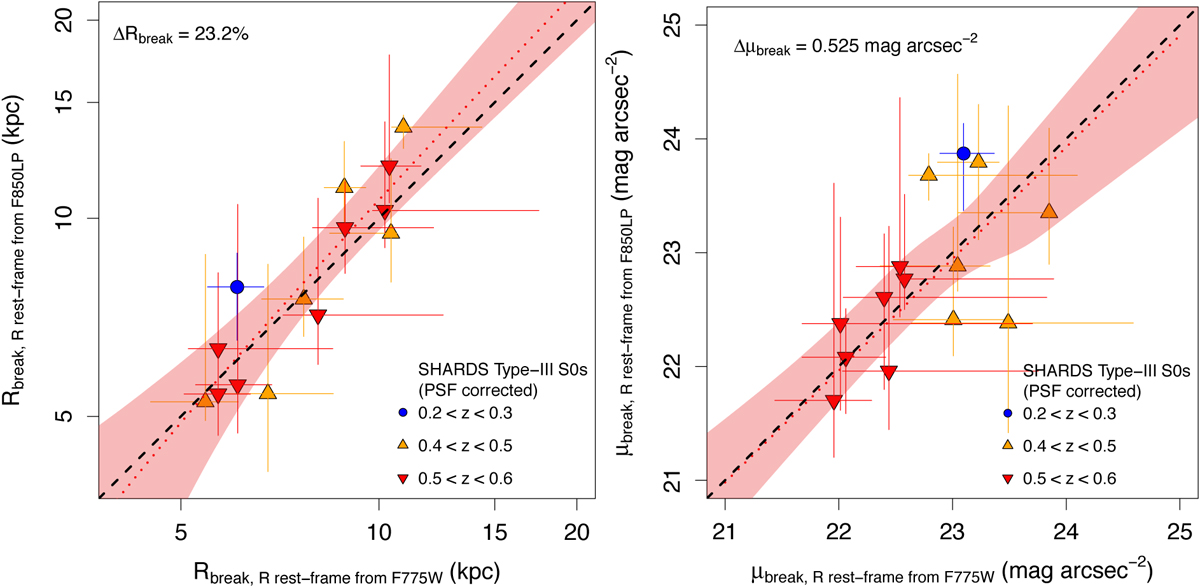
Leftpanel: Rbreak measured in the F850LP profile as a function of the Rbreak measured in the F775W profile, both after correction to the rest-frame R-band. Right panel: μbreak measured in the F850LP profile as a function of the μbreak obtained from the F775W profile, both after correction to the rest-frame R-band. The dashedblack line represents the values that the parameters should have if they were identical. The red dotted line is the linear fit performed to the data in each panel. The colour contour of the linear fit represents the 1σ confidence region of the fit. We refer to Paper I for more information about the morphological classification of the objects. Consult the legend in the figure.
Current usage metrics show cumulative count of Article Views (full-text article views including HTML views, PDF and ePub downloads, according to the available data) and Abstracts Views on Vision4Press platform.
Data correspond to usage on the plateform after 2015. The current usage metrics is available 48-96 hours after online publication and is updated daily on week days.
Initial download of the metrics may take a while.