Fig. 9
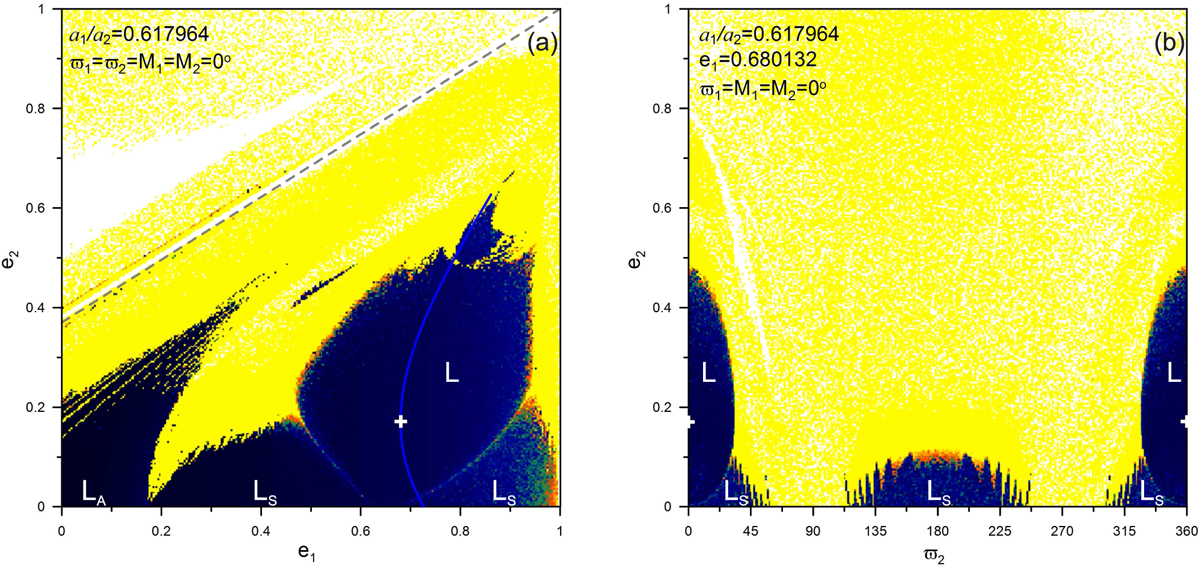
DS-maps on the planes (a) (e1, e2) and (b) (ϖ2, e2) yielded by a periodic orbit (white cross) that belongs to the stable family (blue curve) of the configuration (θ1, θ2) = (0, 0). The dashed grey line depicts the region where the planetary collisions take place. The orbital elements of the periodic orbit that remain fixed during the computation of each map are noted down. The islands of stability showcase the following attributes: L: libration of all resonant angles and apsidal difference (MMR), LS: secondary resonance, LA: apsidal difference oscillation or circulation, and R: rotation of both resonant angles and apsidal difference.
Current usage metrics show cumulative count of Article Views (full-text article views including HTML views, PDF and ePub downloads, according to the available data) and Abstracts Views on Vision4Press platform.
Data correspond to usage on the plateform after 2015. The current usage metrics is available 48-96 hours after online publication and is updated daily on week days.
Initial download of the metrics may take a while.