Fig. 2
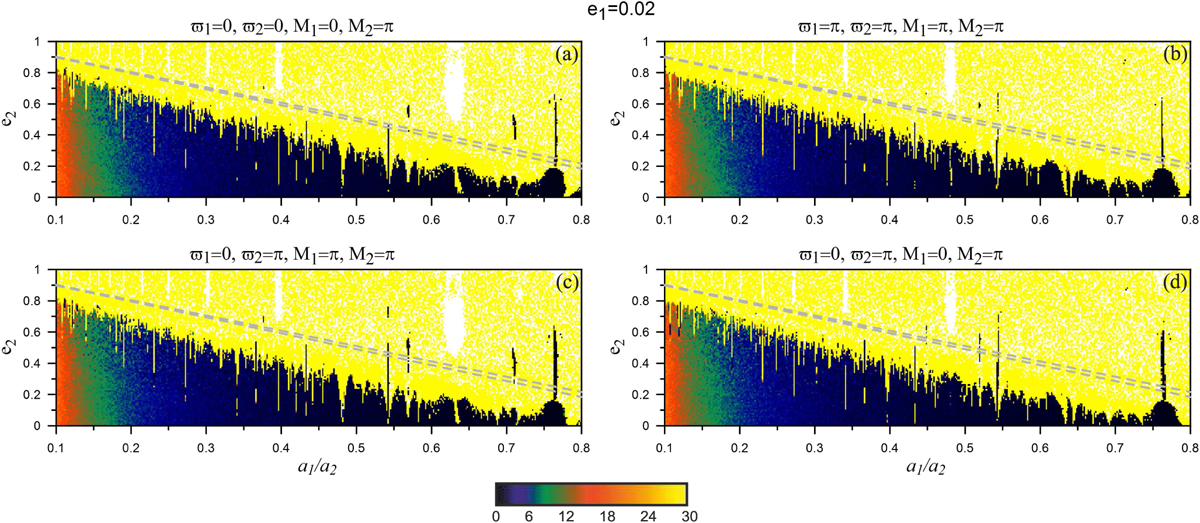
DS-maps on the plane (a1∕a2, e2) when e1 = 0.2. The values of the orbital elements that remained fixed throughout the computation of the DS-maps are noted above each panel. The dashed grey lines indicate the collision lines between the planets. The coloured bar corresponds to the logarithmic values of DFLI; dark (pale) colours showcase regular (irregular) evolution of the orbits, while white colour depicts the very close encounters and the failure of numerical integration at t < 250 kyr.
Current usage metrics show cumulative count of Article Views (full-text article views including HTML views, PDF and ePub downloads, according to the available data) and Abstracts Views on Vision4Press platform.
Data correspond to usage on the plateform after 2015. The current usage metrics is available 48-96 hours after online publication and is updated daily on week days.
Initial download of the metrics may take a while.