Fig. 4.
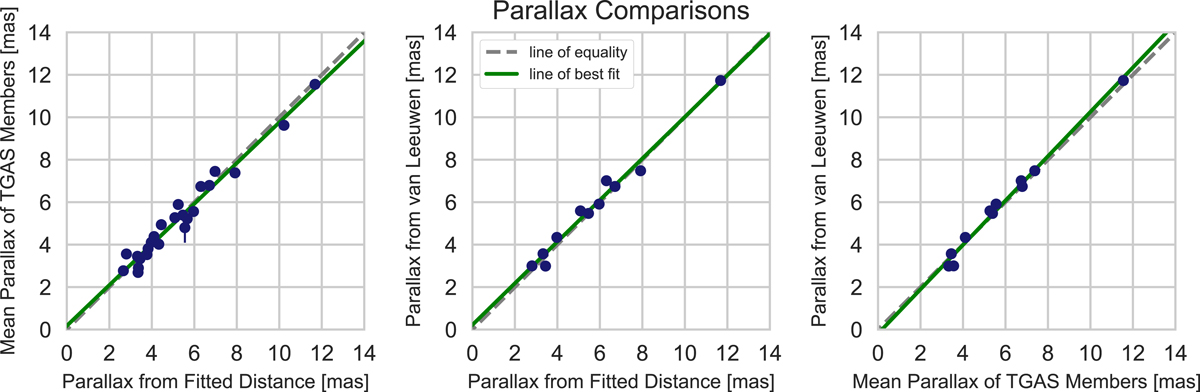
Left panel: comparison of the weighted mean parallax of TGAS cluster members to parallaxes computed from the fitted distances for 24 clusters. The cluster with the largest error bar is Platais 2. Middle panel: comparison of 11 cluster parallaxes from Gaia Collaboration (2017c) to the parallaxes computed from the fitted distances. Right panel: comparison of cluster parallaxes from Gaia Collaboration (2017c) to the weighted mean parallax of TGAS cluster members for 11 clusters. In all plots, the error bars are generally smaller than the marker used. The dashed gray line indicates the line of equality and the green line represents the best fit.
Current usage metrics show cumulative count of Article Views (full-text article views including HTML views, PDF and ePub downloads, according to the available data) and Abstracts Views on Vision4Press platform.
Data correspond to usage on the plateform after 2015. The current usage metrics is available 48-96 hours after online publication and is updated daily on week days.
Initial download of the metrics may take a while.