Fig. 3.
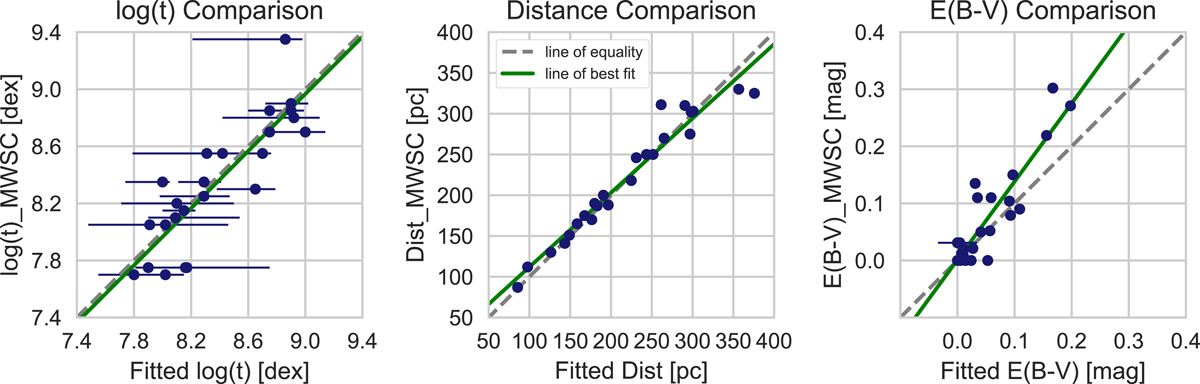
Comparison of 24 fitted cluster parameter results from this work to those determined in MWSC. Horizontal error bars, from this work, are plotted for all three comparisons, but for the fitted distance and fitted E(B − V), the errors are generally smaller than the point marker used. The dashed gray line indicates the line of equality and the green line shows the best fit. Except for the E(B − V), the agreement between MWSC and newly fitted pipeline values is rather good.
Current usage metrics show cumulative count of Article Views (full-text article views including HTML views, PDF and ePub downloads, according to the available data) and Abstracts Views on Vision4Press platform.
Data correspond to usage on the plateform after 2015. The current usage metrics is available 48-96 hours after online publication and is updated daily on week days.
Initial download of the metrics may take a while.