Fig. 3
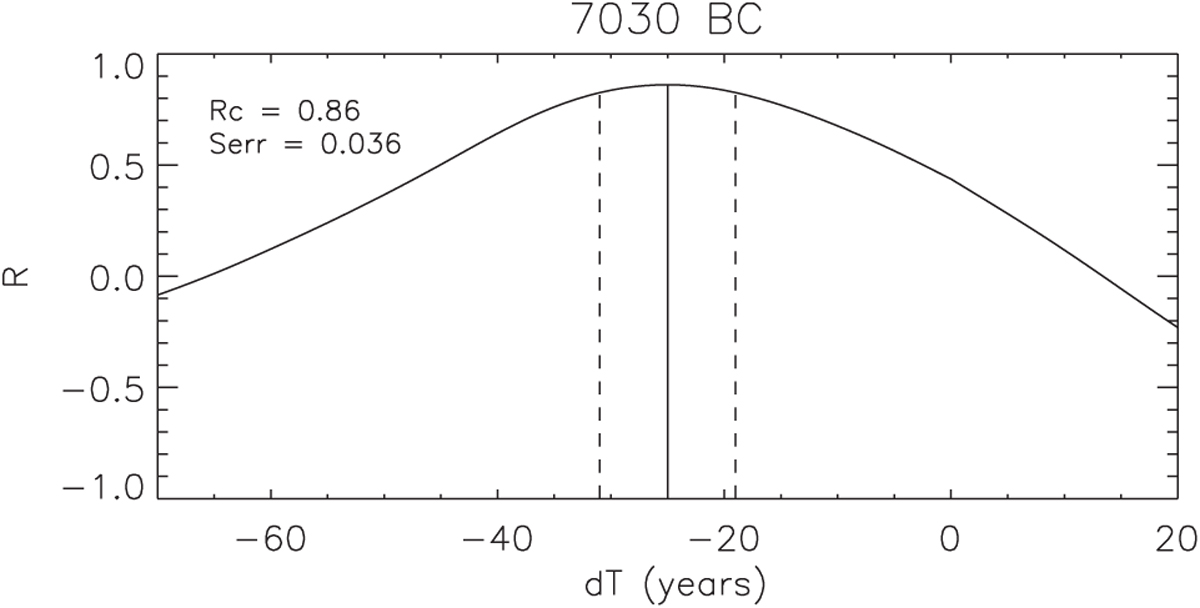
Example of the calculation of the best-fit time adjustment dT = −25 yr (solid vertical line) and its 68% confidence interval (dashed lines, −31 and −19 yr) for the wiggle case shown in Fig. 2. The Pearson linear correlation was calculated between the 14C and EDML 10Be series for the ± 100-yr time window around the center of the wiggle.
Current usage metrics show cumulative count of Article Views (full-text article views including HTML views, PDF and ePub downloads, according to the available data) and Abstracts Views on Vision4Press platform.
Data correspond to usage on the plateform after 2015. The current usage metrics is available 48-96 hours after online publication and is updated daily on week days.
Initial download of the metrics may take a while.