Fig. 2
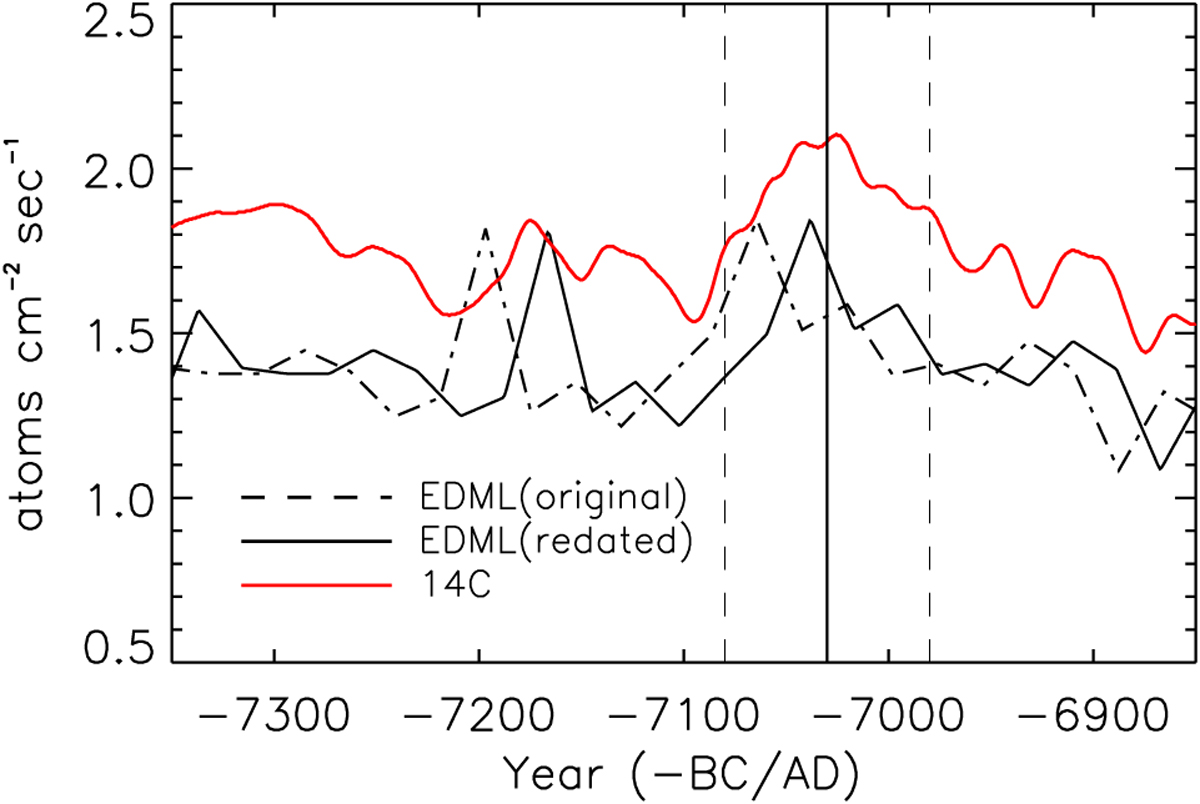
Typical example of a wiggle in the 14C (red) series compared with the original EDML 10Be series (dashed black, scaled up by a factor of 172). Solid and dashed vertical lines denote the middle and the span of the wiggle considered for 14C. The black sold curve shows the EDML 10Be series after the synchronization (see Sect. 3.2).
Current usage metrics show cumulative count of Article Views (full-text article views including HTML views, PDF and ePub downloads, according to the available data) and Abstracts Views on Vision4Press platform.
Data correspond to usage on the plateform after 2015. The current usage metrics is available 48-96 hours after online publication and is updated daily on week days.
Initial download of the metrics may take a while.