Free Access
Fig. 13
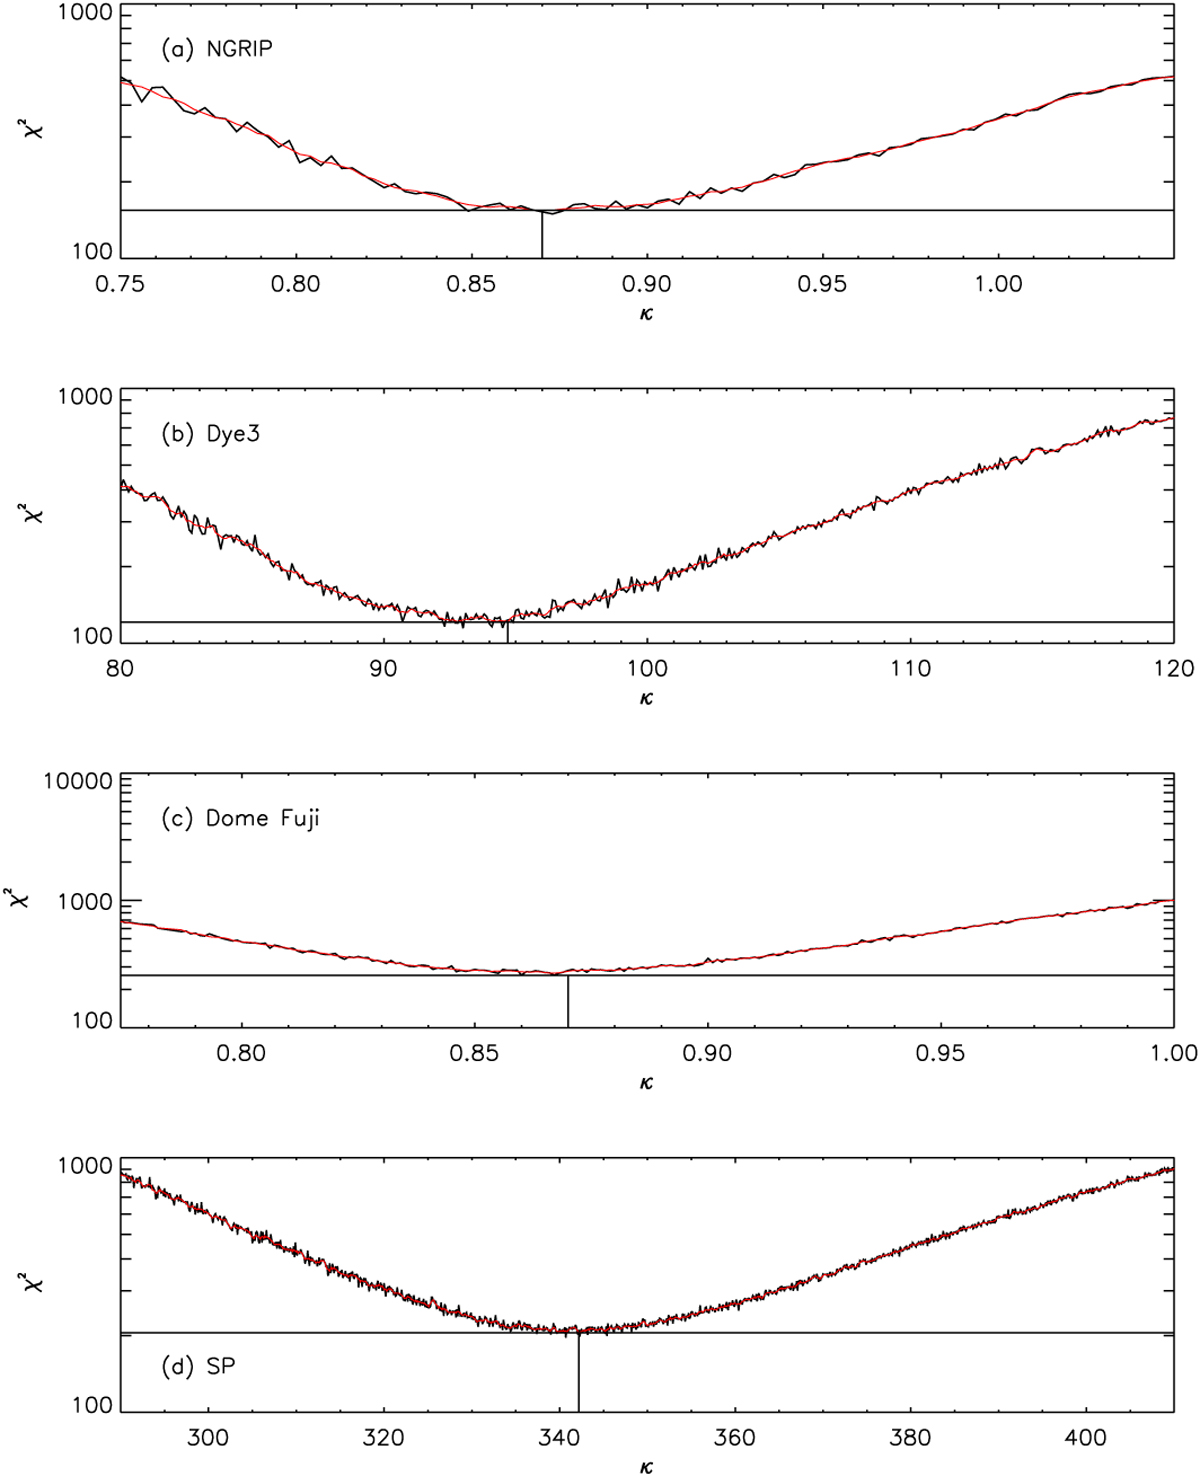
Values of χ2 vs. the scaling factors κ for four short 10Be series, as marked in each panel. The five-point running mean curves are shown in red. The locations of the best-fit κ−values are shown as straight black lines.
Current usage metrics show cumulative count of Article Views (full-text article views including HTML views, PDF and ePub downloads, according to the available data) and Abstracts Views on Vision4Press platform.
Data correspond to usage on the plateform after 2015. The current usage metrics is available 48-96 hours after online publication and is updated daily on week days.
Initial download of the metrics may take a while.