Fig. 12
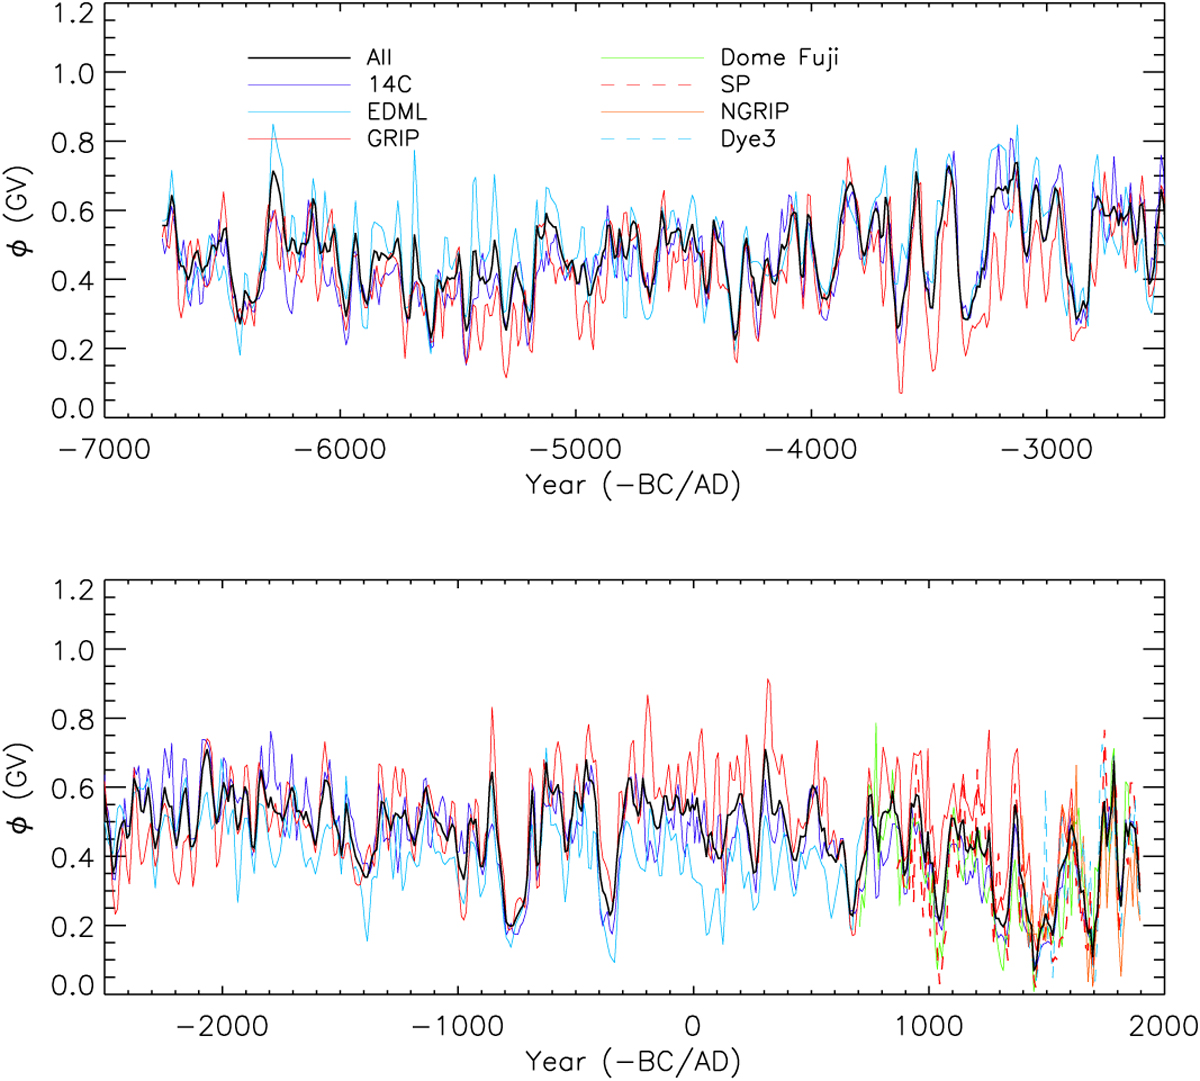
Reconstruction of the modulation potential ϕ using only individual cosmogenic isotope series (color curves as denoted in the legend) with the best-fit scaling (see Table 1) and the final composite series (thick black curve). The top and bottom panels depict the two halves of the entire interval. Only mean values are shown without uncertainties.
Current usage metrics show cumulative count of Article Views (full-text article views including HTML views, PDF and ePub downloads, according to the available data) and Abstracts Views on Vision4Press platform.
Data correspond to usage on the plateform after 2015. The current usage metrics is available 48-96 hours after online publication and is updated daily on week days.
Initial download of the metrics may take a while.