Fig. 4.
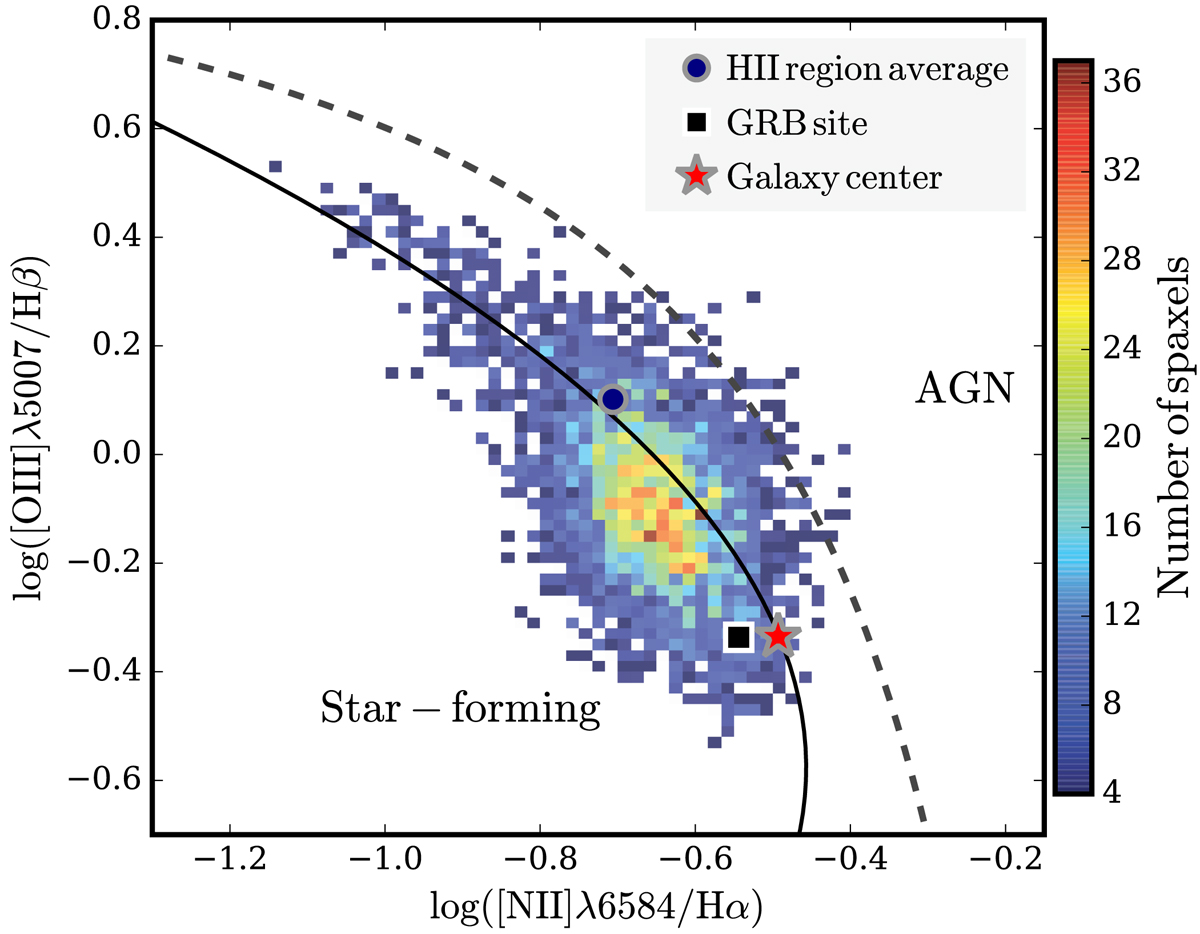
Spaxel BPT diagram of ESO 580-49. Each data point corresponds to the spectrum of a single spaxel, where the individual emission lines are detected with a S/N of at least 3. The GRB explosion site, the galaxy centre, and the H II region average are indicated by large symbols as shown in the legend. The differentiation line between AGN (or shock) and stellar ionization (Kewley et al. 2013) is shown by the dashed line. The solid line denotes the ridge line of local galaxies, i.e. the line with the highest density of SDSS galaxies (Brinchmann et al. 2008).
Current usage metrics show cumulative count of Article Views (full-text article views including HTML views, PDF and ePub downloads, according to the available data) and Abstracts Views on Vision4Press platform.
Data correspond to usage on the plateform after 2015. The current usage metrics is available 48-96 hours after online publication and is updated daily on week days.
Initial download of the metrics may take a while.