Fig. 3.
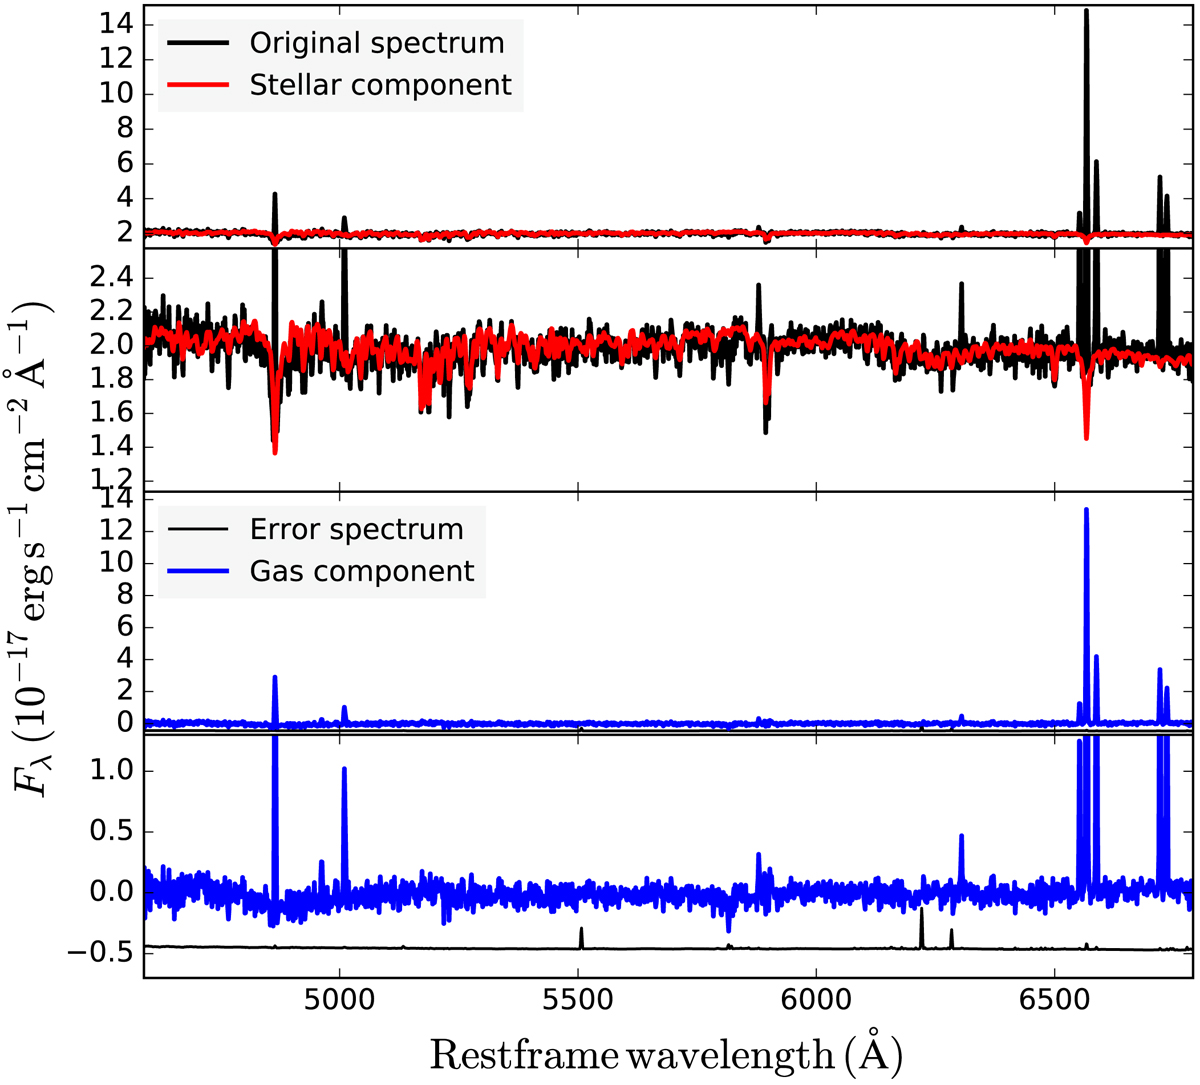
Separating stellar and gas-phase components at the GRB explosion site. Top: original spectrum (black) extracted from the spaxel nearest to the GRB position and fitted stellar component (red). Second: zoom-in of the continuum. Third: resulting spectrum of the gas-phase contribution (blue). Bottom: zoom-in of the gas-phase contribution (blue) together with the error spectrum (black).
Current usage metrics show cumulative count of Article Views (full-text article views including HTML views, PDF and ePub downloads, according to the available data) and Abstracts Views on Vision4Press platform.
Data correspond to usage on the plateform after 2015. The current usage metrics is available 48-96 hours after online publication and is updated daily on week days.
Initial download of the metrics may take a while.