Fig. 6.
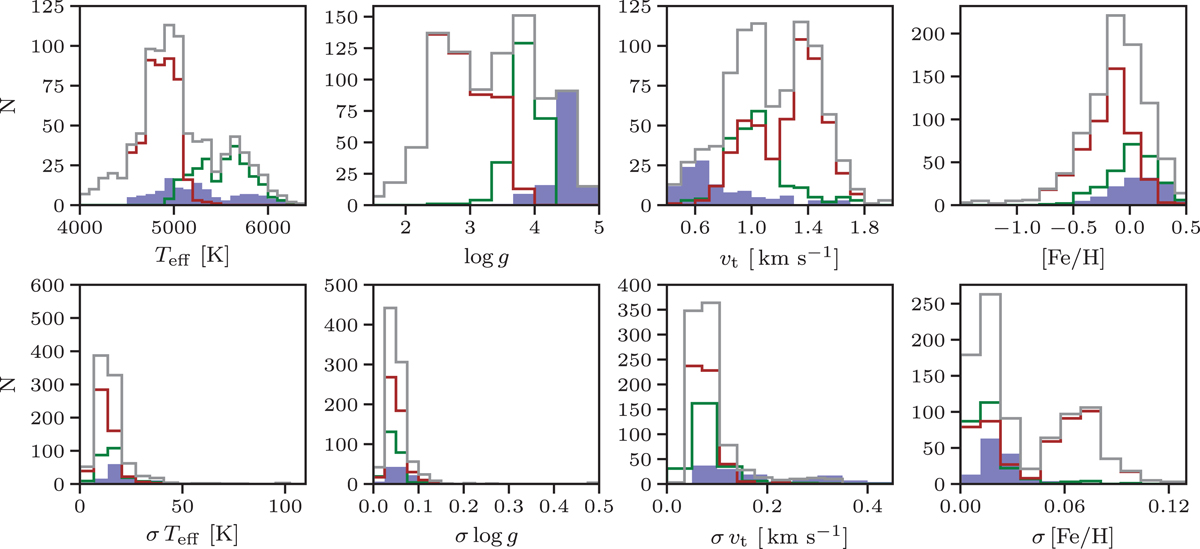
Histograms of the atmospheric parameters Teff, log g, vt, and [Fe/H] (upper panel) and their uncertainties (lower panel) for the complete PTPS sample of 885 stars with uniform spectroscopic analysis. The subsamples, as defined in Sect. 5, are colour coded. The blue area indicates dwarfs; the green line indicates subgiants; the brown line indicates giants; and the grey line indicates the whole sample.
Current usage metrics show cumulative count of Article Views (full-text article views including HTML views, PDF and ePub downloads, according to the available data) and Abstracts Views on Vision4Press platform.
Data correspond to usage on the plateform after 2015. The current usage metrics is available 48-96 hours after online publication and is updated daily on week days.
Initial download of the metrics may take a while.