Fig. 10.
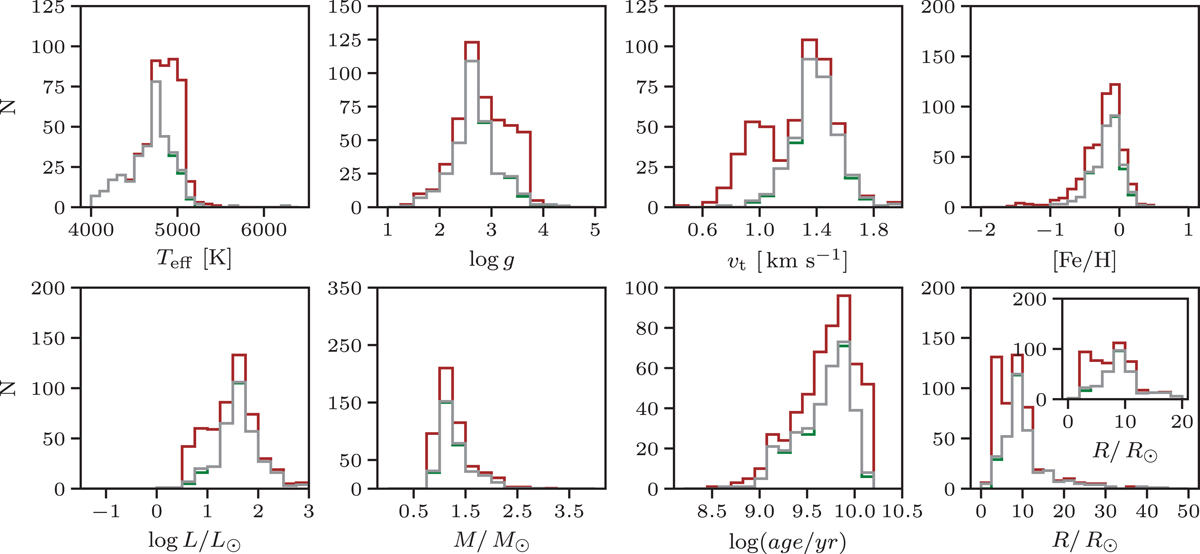
Evolution of the PTPS giants subsample definition. Histograms of atmospheric parameters: Teff, log g, vt, and [Fe/H] (upper panel) as well as luminosities, masses, ages, and radii (lower panel) for the complete PTPS sample of red giant stars with uniform spectroscopic analysis are shown. The evolution of the subsample definition is colour coded: the red line indicates the final red giants sample of 515 stars as defined in this paper; the green line indicates giants from Paper I only (320 red clump giants); and the gray line indicates all 348 stars from Paper I.
Current usage metrics show cumulative count of Article Views (full-text article views including HTML views, PDF and ePub downloads, according to the available data) and Abstracts Views on Vision4Press platform.
Data correspond to usage on the plateform after 2015. The current usage metrics is available 48-96 hours after online publication and is updated daily on week days.
Initial download of the metrics may take a while.