Free Access
Fig. 6
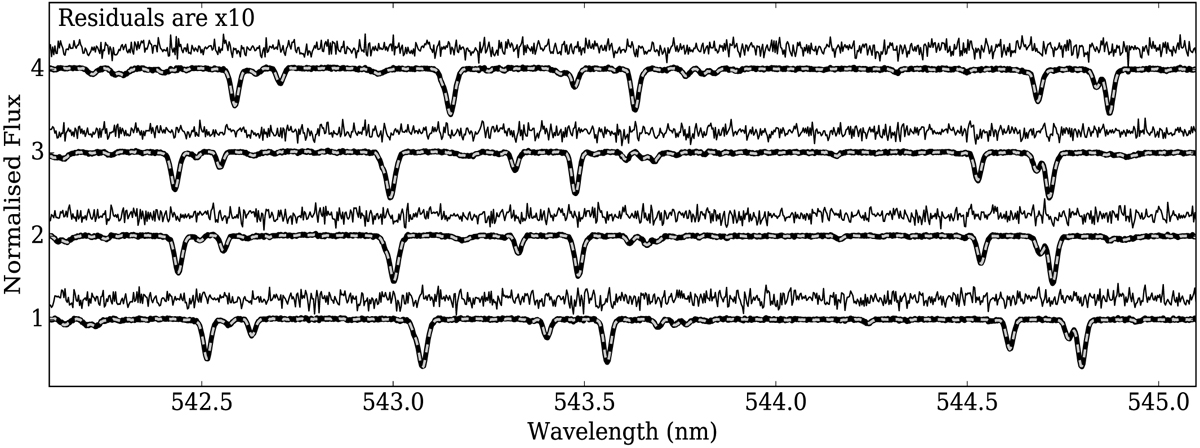
Observed (black) and recombined disentangled spectra (grey dashed) around the Fe I line at 543.452 nm for four spectra fromWASP 0639-32. The residuals, scaled by a factor of 10, are shown 0.25 above each spectrum segment. Plotted with an offset of 1.0 between spectra.
Current usage metrics show cumulative count of Article Views (full-text article views including HTML views, PDF and ePub downloads, according to the available data) and Abstracts Views on Vision4Press platform.
Data correspond to usage on the plateform after 2015. The current usage metrics is available 48-96 hours after online publication and is updated daily on week days.
Initial download of the metrics may take a while.