Fig. 8
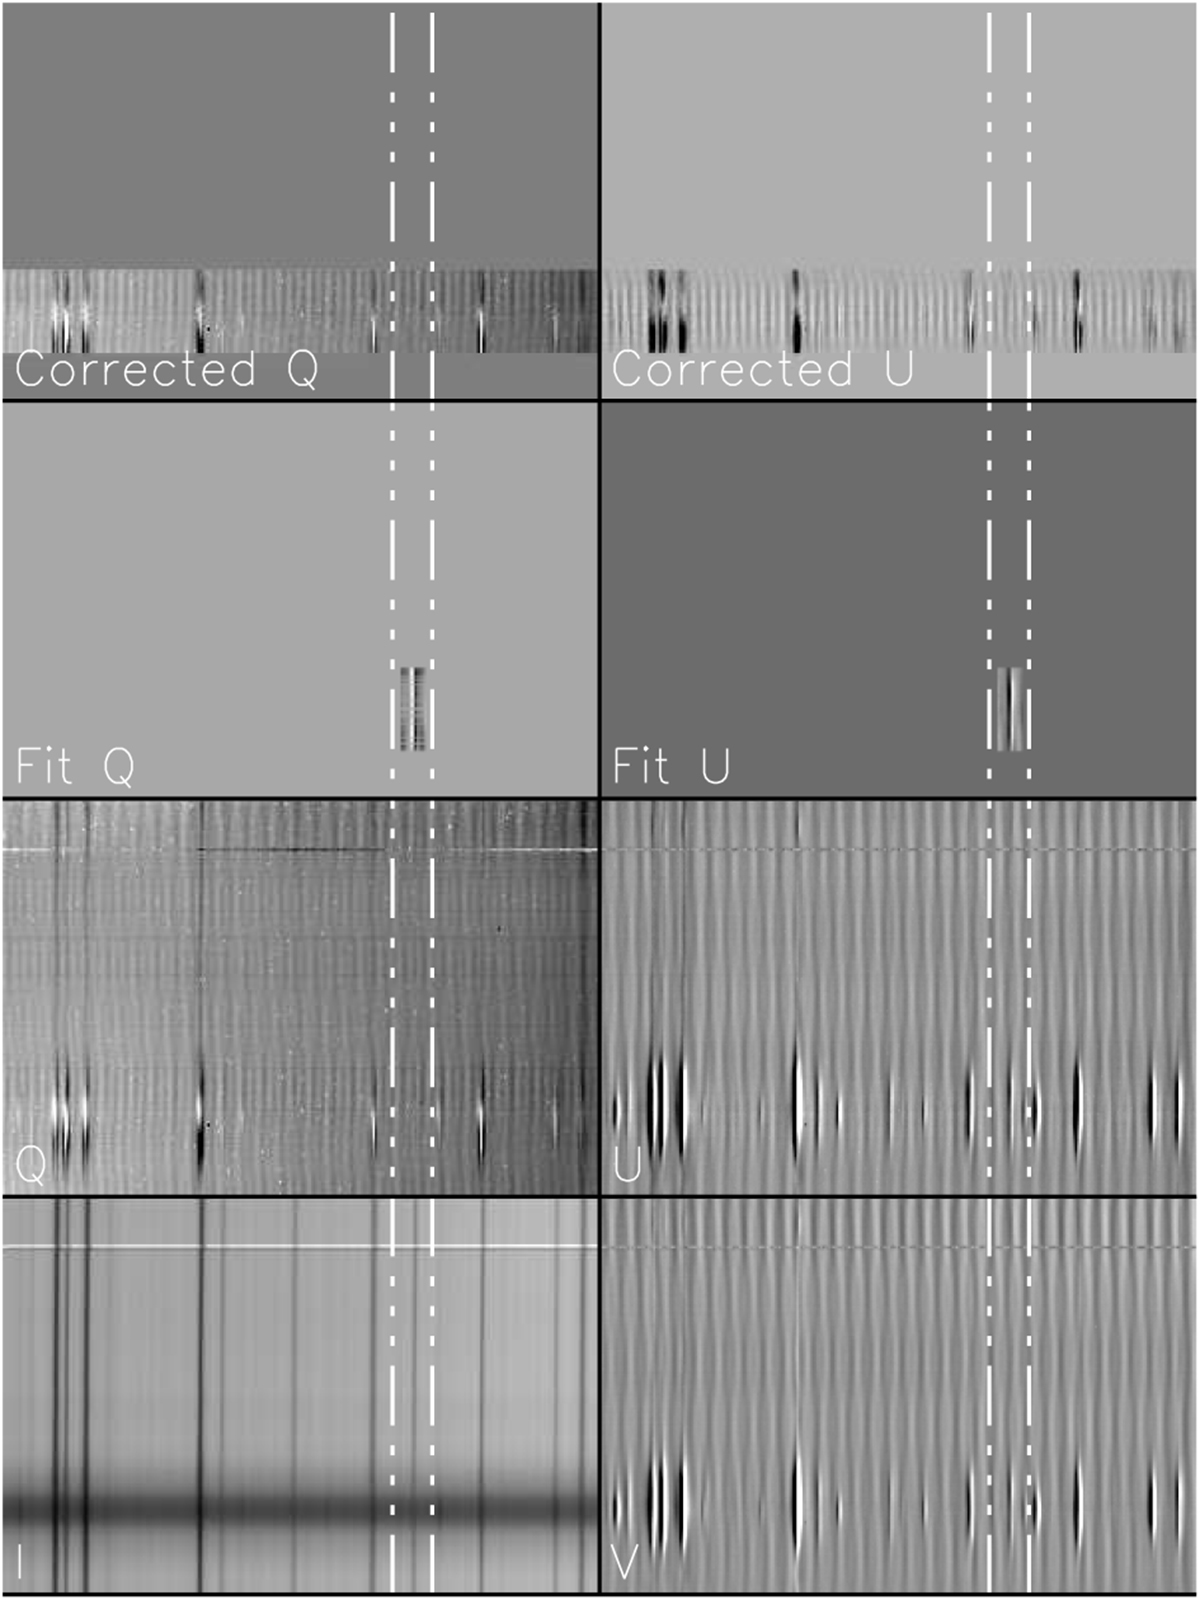
Example slit spectrum at 615 nm with the fit of V → QU. Left column, bottom to top: Stokes I, Stokes Q, the fitted Q = αQ ⋅ V and the Stokes Q signal after correction, Q′ = Q − αQ⋅V. Right column, bottom to top: Stokes V, Stokes U, the fitted U = αU⋅V and the Stokes U signal after correction, U′ = U − αU⋅V. The verticaldash-dotted lines enclose the 614.9 nm line.
Current usage metrics show cumulative count of Article Views (full-text article views including HTML views, PDF and ePub downloads, according to the available data) and Abstracts Views on Vision4Press platform.
Data correspond to usage on the plateform after 2015. The current usage metrics is available 48-96 hours after online publication and is updated daily on week days.
Initial download of the metrics may take a while.